![]() Littlefish FX Analysts
Littlefish FX Analysts
Littlefish FX
The Moving Average Convergence/Divergence (MACD) is a strategy which utilises moving average lines, which are created by previous price trends. It was developed by Gerald Appel in the 1970’s and in 1986, Thomas Aspray added a further component to it (the histogram) to bring it its current state.
Why Use MACD?
The MACD strategy can be used to isolate various signals, but it is most reliable when it is used to follow trends, and gauge the momentum of the trend. This is when the strategy is at its most effective, and is most forgiving to beginners and less experiences traders.
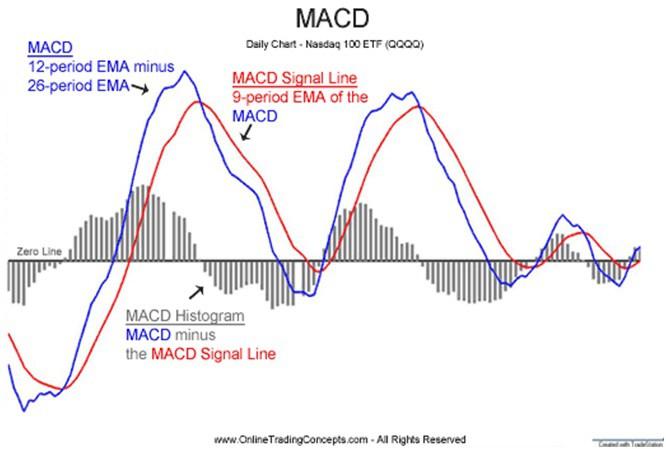
It is comprised of three indicators; the MACD line, the MACD signal line, and a histogram. The zero-line, or centre line, can also be used to inform the trader about price action, but we’ll set this aside for now to minimise confusion. Below is a chart featuring all three indicators with their corresponding labels.
Understanding The Three Indicators
MACD LINE
The MACD line is calculated by taking the difference between the 12-period exponential moving average, and the 26-period exponential moving average (EMA). The EMA tracks the latest price trend. By taking the difference between two EMAs with different timeframes, the trader can detect trend fluctuations.
MACD SIGNAL LINE
The MACD signal line is a 9-period exponential moving average of the MACD line. The convergence and divergence between the two lines is an indication of the momentum in the price action, but crucially and most obviously, it is an indication of the price trend.
When the MACD line crosses above the signal line it is a bullish trend, and when the signal line crosses above the MACD it is bearish.
HISTOGRAM
The histogram is a visual representation of the difference between the MACD line and the MACD signal line. As mentioned above, the gap between the two lines is an indication of momentum, and the histogram clearly measures that momentum in bars. As momentum accelerates the trader is given an idea of the strength of the price action, and any forthcoming changes to the price as momentum decelerates.
The histogram is positive when the MACD line is above the signal line (bullish), and negative when the signal line is above the MACD line (bearish).
How To Trade With MACD
There are various ways to use this strategy, but we’ll only be going through two of them here. The first method is to initiate a position when one of the MACD lines crosses over the other, which represents a change in trend. The second is by using the centre line crossover method – more on this below.
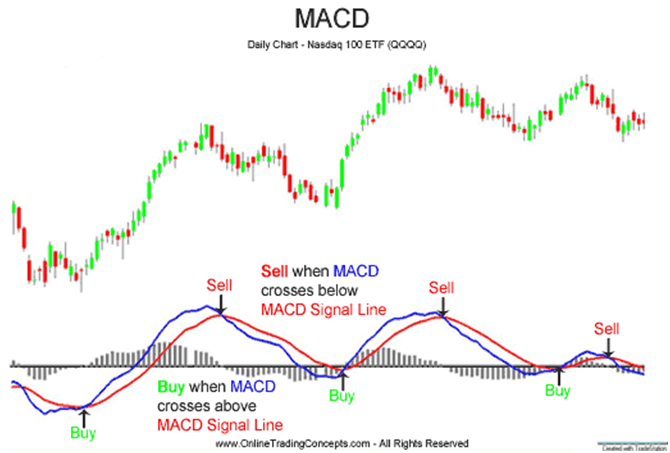
MACD LINE CROSSOVER
This is one of the most widely used trading techniques, and it is pretty self explanatory. Whenever the MACD line crosses over the signal line (or vice versa), it signals the end of a trend, and the trader should consider buying or selling. This is shown on the graph below.
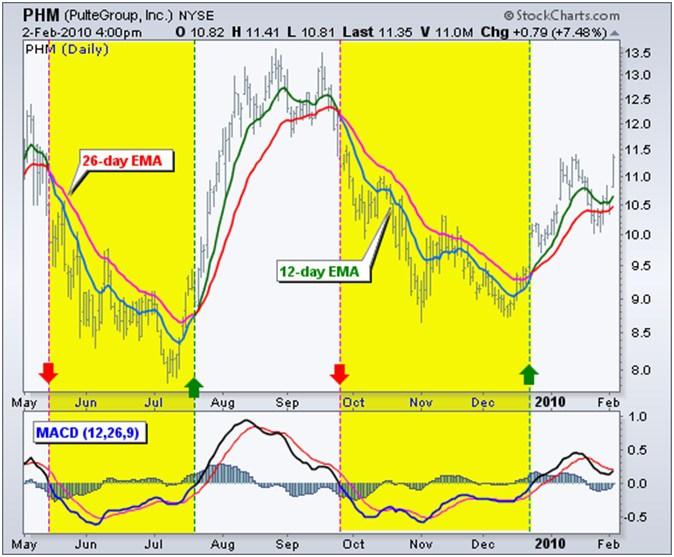
CENTRE LINE CROSSOVER
The centre line method ignores the MACD signal line, and focuses only on the MACD line and the centre line. Whenever the MACD line crosses over the centre line, it is used as an indicator to initiate a position – see below.
Recalling that the MACD line represents the difference between the 12-period EMA and the 26-period EMA on the price chart, whenever the MACD line touches the centre line (which represents zero in value) the 12-period EMA and 26-period EMA are equal and the difference is zero.
Notice that this intersection directly correlates with an intersection (or crossover) of the two EMAs (MACD lines) on the price chart.
As with any other trading technique, the MACD strategy comes with its risks as it is based on previous price action. And like most oscillator indicators, it can provide false signals where there are no long-term trends. That being said, it does provide very strong predictive value and when used correctly, can help to lock in some very significant gains.
All comments, charts and analysis on this website are purely provided to demonstrate our own personal thoughts and views of the market and should in no way be treated as recommendations or advice. Please do not trade based solely on any information provided within this site, always do your own analysis.
Editors’ Picks

EUR/USD flirts with daily highs, retargets 1.1900
EUR/USD regains upside traction, returning to the 1.1880 zone and refocusing its attention to the key 1.1900 barrier. The pair’s slight gains comes against the backdrop of a humble decline in the US Dollar as investors continue to assess the latest US CPI readings and the potential Fed’s rate path.

GBP/USD remains well bid around 1.3650
GBP/USD maintains its upside momentum in place, hovering around daily highs near 1.3650 and setting aside part of the recent three-day drop. Cable’s improved sentiment comes on the back of the Greenback’s irresolute price action, while recent hawkish comments from the BoE’s Pill also collaborate with the uptick.

USD/JPY edges up above 153.50 with all eyes on US CPI figures
USD/JPY appreciates above 153.00 but remains on track for a 2.4% weekly loss. Trading volumes remain subdued on Friday, ahead of the IS CPI release. The Yen remains supported by hopes of a stable government and calls for further BoJ tightening.
Editors’ Picks

EUR/USD: Yes, the US economy is resilient – No, that won’t save the US Dollar Premium
Some impressive US data should have resulted in a much stronger USD. Well, it didn’t happen. The EUR/USD pair closed a third consecutive week little changed, a handful of pips above the 1.1800 mark.

Gold: Metals remain vulnerable to broad market mood Premium
Gold (XAU/USD) started the week on a bullish note and climbed above $5,000 before declining sharply and erasing its weekly gains on Thursday, only to recover heading into the weekend.

GBP/USD: Pound Sterling remains below 1.3700 ahead of UK inflation test Premium
The Pound Sterling (GBP) failed to resist at higher levels against the US Dollar (USD), but buyers held their ground amid a US data-busy blockbuster week.

Bitcoin: BTC bears aren’t done yet
Bitcoin (BTC) price slips below $67,000 at the time of writing on Friday, remaining under pressure and extending losses of nearly 5% so far this week.

US Dollar: Big in Japan Premium
The US Dollar (USD) resumed its yearly downtrend this week, slipping back to two-week troughs just to bounce back a tad in the second half of the week.
RECOMMENDED LESSONS
Making money in forex is easy if you know how the bankers trade!
I’m often mystified in my educational forex articles why so many traders struggle to make consistent money out of forex trading. The answer has more to do with what they don’t know than what they do know. After working in investment banks for 20 years many of which were as a Chief trader its second knowledge how to extract cash out of the market.
5 Forex News Events You Need To Know
In the fast moving world of currency markets where huge moves can seemingly come from nowhere, it is extremely important for new traders to learn about the various economic indicators and forex news events and releases that shape the markets. Indeed, quickly getting a handle on which data to look out for, what it means, and how to trade it can see new traders quickly become far more profitable and sets up the road to long term success.
Top 10 Chart Patterns Every Trader Should Know
Chart patterns are one of the most effective trading tools for a trader. They are pure price-action, and form on the basis of underlying buying and selling pressure. Chart patterns have a proven track-record, and traders use them to identify continuation or reversal signals, to open positions and identify price targets.
7 Ways to Avoid Forex Scams
The forex industry is recently seeing more and more scams. Here are 7 ways to avoid losing your money in such scams: Forex scams are becoming frequent. Michael Greenberg reports on luxurious expenses, including a submarine bought from the money taken from forex traders. Here’s another report of a forex fraud. So, how can we avoid falling in such forex scams?
What Are the 10 Fatal Mistakes Traders Make
Trading is exciting. Trading is hard. Trading is extremely hard. Some say that it takes more than 10,000 hours to master. Others believe that trading is the way to quick riches. They might be both wrong. What is important to know that no matter how experienced you are, mistakes will be part of the trading process.
The challenge: Timing the market and trader psychology
Successful trading often comes down to timing – entering and exiting trades at the right moments. Yet timing the market is notoriously difficult, largely because human psychology can derail even the best plans. Two powerful emotions in particular – fear and greed – tend to drive trading decisions off course.