Guest post by Marcus Holland of Options Trading
The V-ROC has no accredited designer and it functions by focusing on volume as opposed to price. In all other respects, the V-ROC is identical to the standard and better known Rate of Change indicator. Essentially, the V-ROC computes and then presents the rate at which volume alters.
You will find that most experts recommend that volume is a useful factor to track because sharp surges in volumeusually accompany changes in the direction of price. Consequently, the V-ROC can provide you with useful information representing the correlation between the directional movements of volumes and price for any asset of interest.
In addition, the V-ROC is useful in detecting new bullish and bearish price trends by monitoring volume. In the diagram below, you will notice that the V-ROC oscillates about zero generating larger values when volume increases and lower readings when it declines.
The readings of the V-ROC are determined by dividing the entire volume movement over a specified time period by its initial reading at the start of that period. As such, you need to realize that if volume contracts during your chosen time-period, then a negative reading will be displayed while if it expands, then a positive value will be registered.
You can optimize your usage of the V-ROC by deploying it to identify market bottoms, market tops, breakouts and overbought/oversold conditions. You can perform these tasks by using the V-ROC because all these trading events are associated with rapid surges in volume. Experts will also recommend that you verify your V-ROC findings by seeking additional confirmation using other applicable technical indicators as well as by studying the recent trading history of the asset of interest.
However, you will be confounded by one problem should you choose to use the V-ROC. Basically, you need to decide on the optimum time-period to utilize that will allow you to best track the rate of volume change. For example, if you should choose a time period that is too small then the V-ROC could start producing readings that are too sensitive. Alternatively, if you select a time period that is excessively long, then the V-ROC could respond too slowly to major price events such as retracements and reversals.
Many experts advise, after undertaking extensive research and from their own trading experiences, that the optimum time-period to deploy is the 25-day. A major advantage of using this value is that trading charts based on this time period are relatively easy to analyze.
By studying the readings produced by the V-ROC, you can acquire deep insights into many significant trading conditions and major events. For example, if you notice that price is climbing in value but that the V-ROC readings are still oscillating about zero, then this is a major signal advising that a price reversal could occur very soon. This is because volume levels displayed are no longer supporting further price growth. In addition, you can derive a similar deduction if the V-ROC starts to retract or continues to trade in a horizontal pattern.
You can deploy the many advantageous features of the V-ROC to improve your trading results and boost your profitability in numerous ways. One of the most popular is to help differentiate real breakouts from fakeouts. This is because breakouts can very often provide you with quality trading opportunities that can be readily detected. However, you need to still adopt caution by ensuring that a fakeout does not just materialize which could stop-out your new positions.
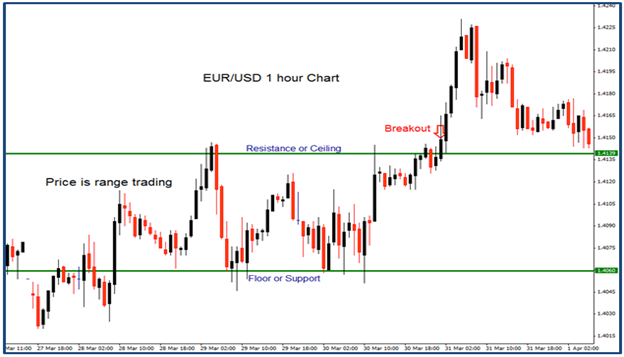
Essentially, if price has traded within a constricted range between well-defined support and resistance levels, a breakout will occur when it attains a sustained break through either of these important levels. The next chart illustrates a breakout.
In the above chart, you may well be tempted to initiate a new position as soon as price breaks above the resistance level. However, you need to be careful because a fakeout could be produced as shown on the next chart.

To protect yourself from such eventualities, you could deploy the V-ROC to provide additional confirmation before you open a new trade. In the case of a real breakout, the V-ROC will display a continuous stream of high readings. However, if a fakeout materializes then you will notice a sharp drop in volume activity.
Editors’ Picks

EUR/USD: Yes, the US economy is resilient – No, that won’t save the US Dollar Premium
Some impressive US data should have resulted in a much stronger USD. Well, it didn’t happen. The EUR/USD pair closed a third consecutive week little changed, a handful of pips above the 1.1800 mark.

Gold: Metals remain vulnerable to broad market mood Premium
Gold (XAU/USD) started the week on a bullish note and climbed above $5,000 before declining sharply and erasing its weekly gains on Thursday, only to recover heading into the weekend.

GBP/USD: Pound Sterling remains below 1.3700 ahead of UK inflation test Premium
The Pound Sterling (GBP) failed to resist at higher levels against the US Dollar (USD), but buyers held their ground amid a US data-busy blockbuster week.

Bitcoin: BTC bears aren’t done yet
Bitcoin (BTC) price slips below $67,000 at the time of writing on Friday, remaining under pressure and extending losses of nearly 5% so far this week.

US Dollar: Big in Japan Premium
The US Dollar (USD) resumed its yearly downtrend this week, slipping back to two-week troughs just to bounce back a tad in the second half of the week.
RECOMMENDED LESSONS
Making money in forex is easy if you know how the bankers trade!
I’m often mystified in my educational forex articles why so many traders struggle to make consistent money out of forex trading. The answer has more to do with what they don’t know than what they do know. After working in investment banks for 20 years many of which were as a Chief trader its second knowledge how to extract cash out of the market.
5 Forex News Events You Need To Know
In the fast moving world of currency markets where huge moves can seemingly come from nowhere, it is extremely important for new traders to learn about the various economic indicators and forex news events and releases that shape the markets. Indeed, quickly getting a handle on which data to look out for, what it means, and how to trade it can see new traders quickly become far more profitable and sets up the road to long term success.
Top 10 Chart Patterns Every Trader Should Know
Chart patterns are one of the most effective trading tools for a trader. They are pure price-action, and form on the basis of underlying buying and selling pressure. Chart patterns have a proven track-record, and traders use them to identify continuation or reversal signals, to open positions and identify price targets.
7 Ways to Avoid Forex Scams
The forex industry is recently seeing more and more scams. Here are 7 ways to avoid losing your money in such scams: Forex scams are becoming frequent. Michael Greenberg reports on luxurious expenses, including a submarine bought from the money taken from forex traders. Here’s another report of a forex fraud. So, how can we avoid falling in such forex scams?
What Are the 10 Fatal Mistakes Traders Make
Trading is exciting. Trading is hard. Trading is extremely hard. Some say that it takes more than 10,000 hours to master. Others believe that trading is the way to quick riches. They might be both wrong. What is important to know that no matter how experienced you are, mistakes will be part of the trading process.
The challenge: Timing the market and trader psychology
Successful trading often comes down to timing – entering and exiting trades at the right moments. Yet timing the market is notoriously difficult, largely because human psychology can derail even the best plans. Two powerful emotions in particular – fear and greed – tend to drive trading decisions off course.


