![]() Littlefish FX Analysts
Littlefish FX Analysts
Littlefish FX
A Brief History Of The Candlestick
Candlesticks were developed by Japanese rice traders nearly 300 years ago.
There are a number of different candlestick patterns which are worth keeping an eye out for, but since we haven’t got 300 years, we’re going to have a look at just one of the top candlesticks patterns for now, which should set you off on the right track.
Introducing The Engulfing Pattern
So say hello to the Engulfing Pattern, which is when the second candlestick ‘engulfs’ the previous candlestick in the opposite direction.
This shows a pure rejection of the previous price action and is a definite sign that the market did not take kindly to the previous move. The engulfing pattern can therefore be both a Bearish reversal signal (if spotted at the top of an uptrend) or a Bullish one (if at the bottom of a downtrend).
Bullish Engulfing
A Bullish Engulfing candlestick pattern is when an initial downward candlestick (close lower than open) is immediately followed by an upward (close higher than open) candlestick that is bigger than it, or entirely engulfs it, that is to say the low is equal to or lower than the previous low, the high is higher than the previous high, and the close is higher than the previous open.
Take a look at these charts to help you better understand what we’re talking about.
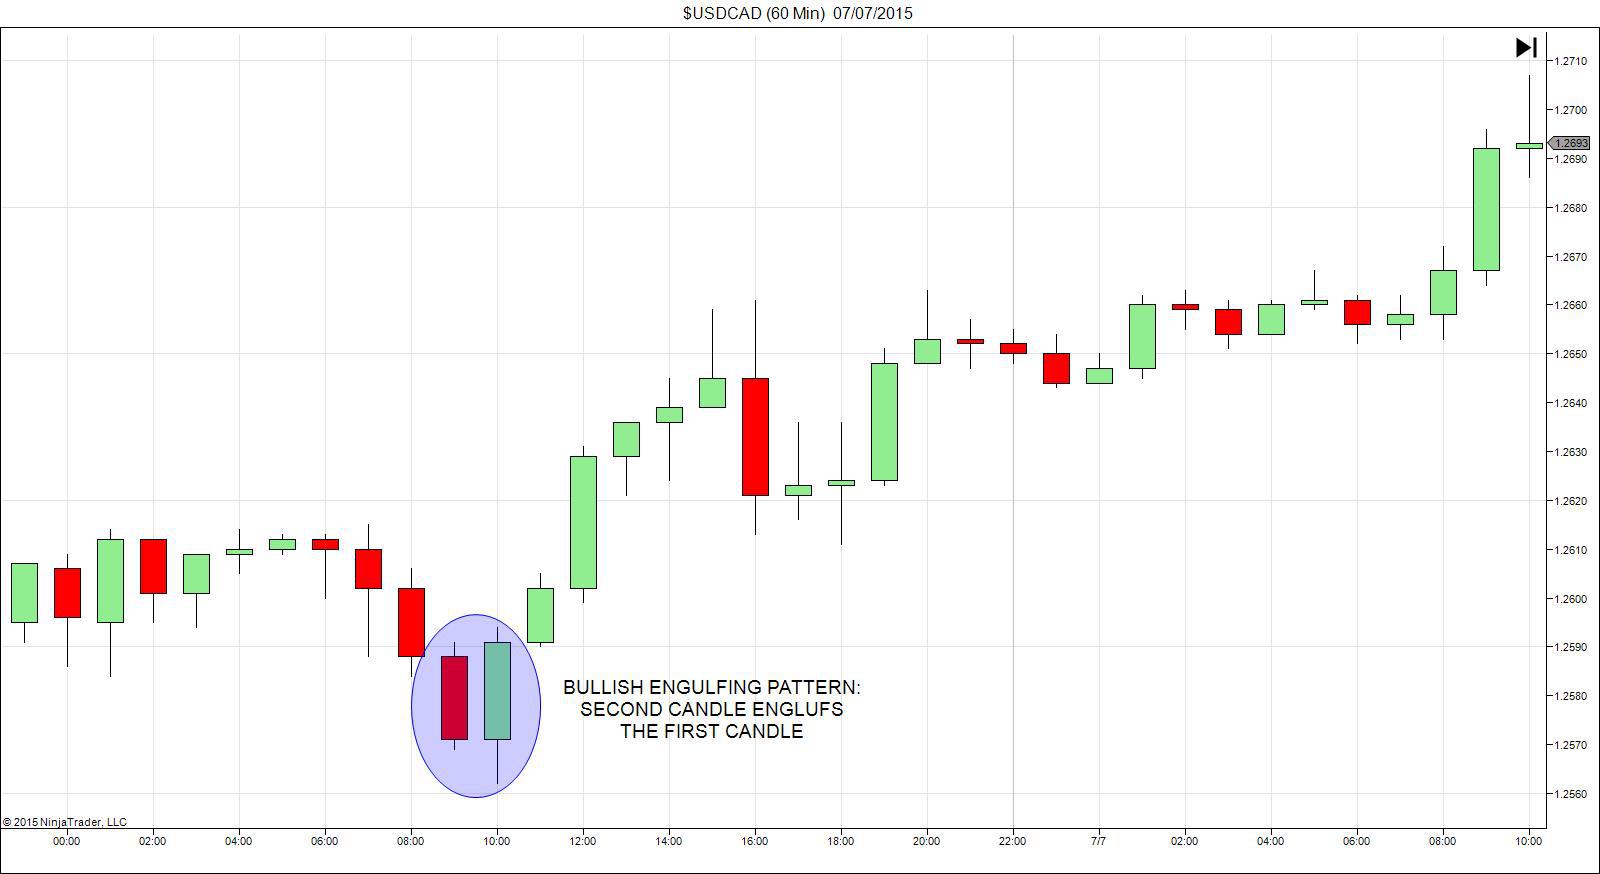
This essentially means that from a supply and demand point of view, the buyers have stepped into the market to ensure it doesn’t drop any lower. This could then result in a push higher as the buyers overwhelm the sellers. Therefore, it can be taken as a Bullish signal.
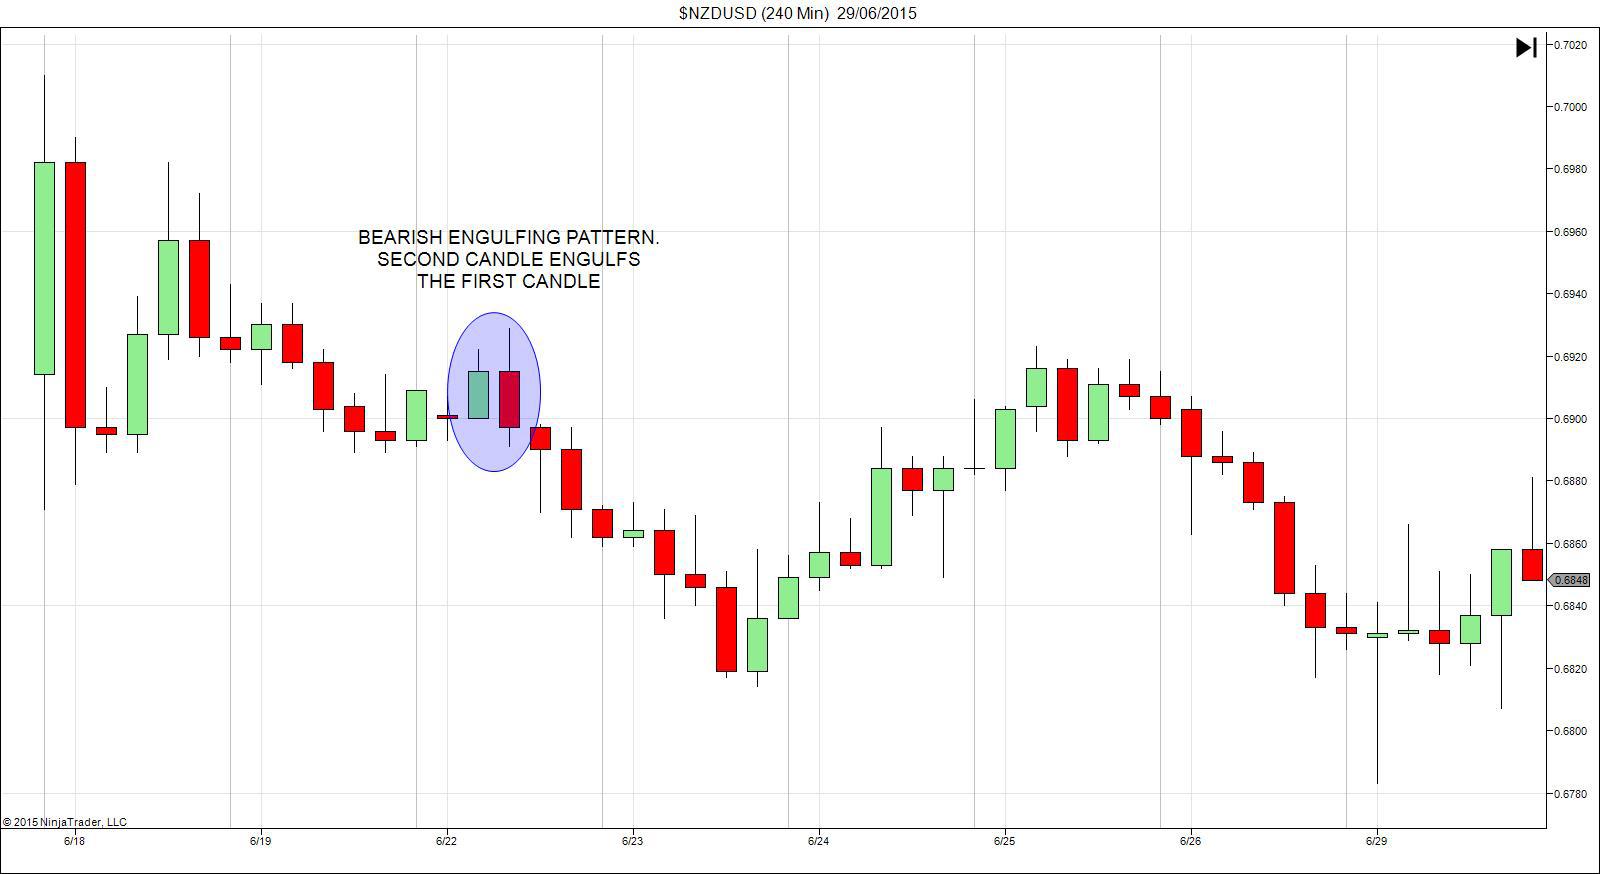
Bearish Engulfing
The Bearish Signal is simply the opposite of this, as seen below.
This is a great pattern to look out for and is very effective in two forms, at bottoms and tops looking for turning points, which is relatively high risk, or for trend continuation patterns.
Engulfing In A Strategy
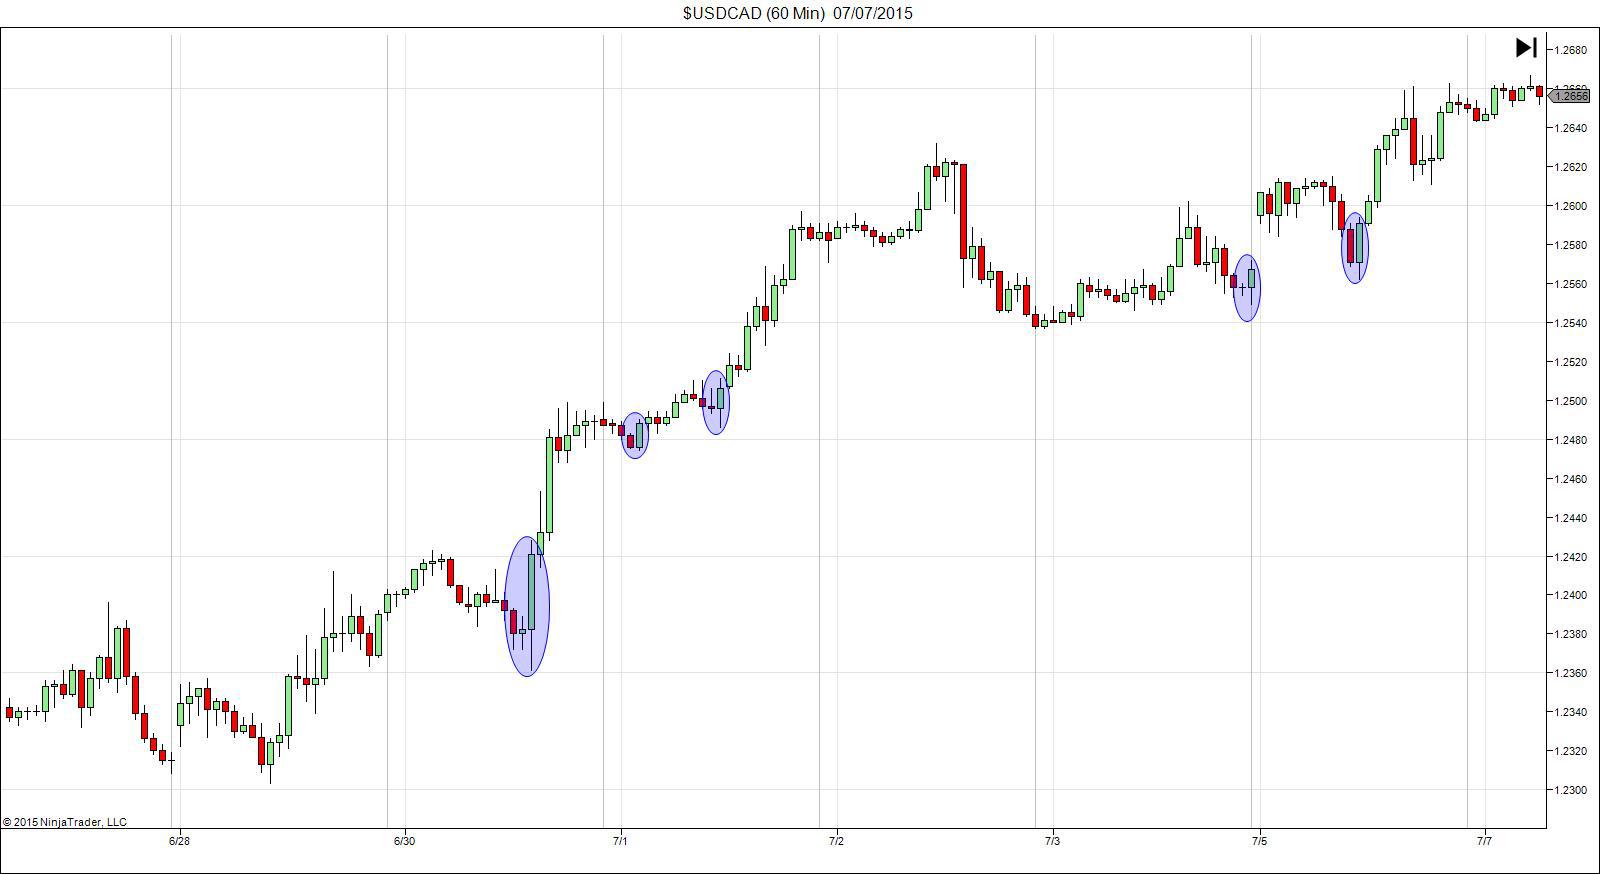
A really nice trading strategy is to look for Bullish engulfing signals in uptrends and Bearish engulfing patterns in downtrends, as they can be good signs of trend continuation.
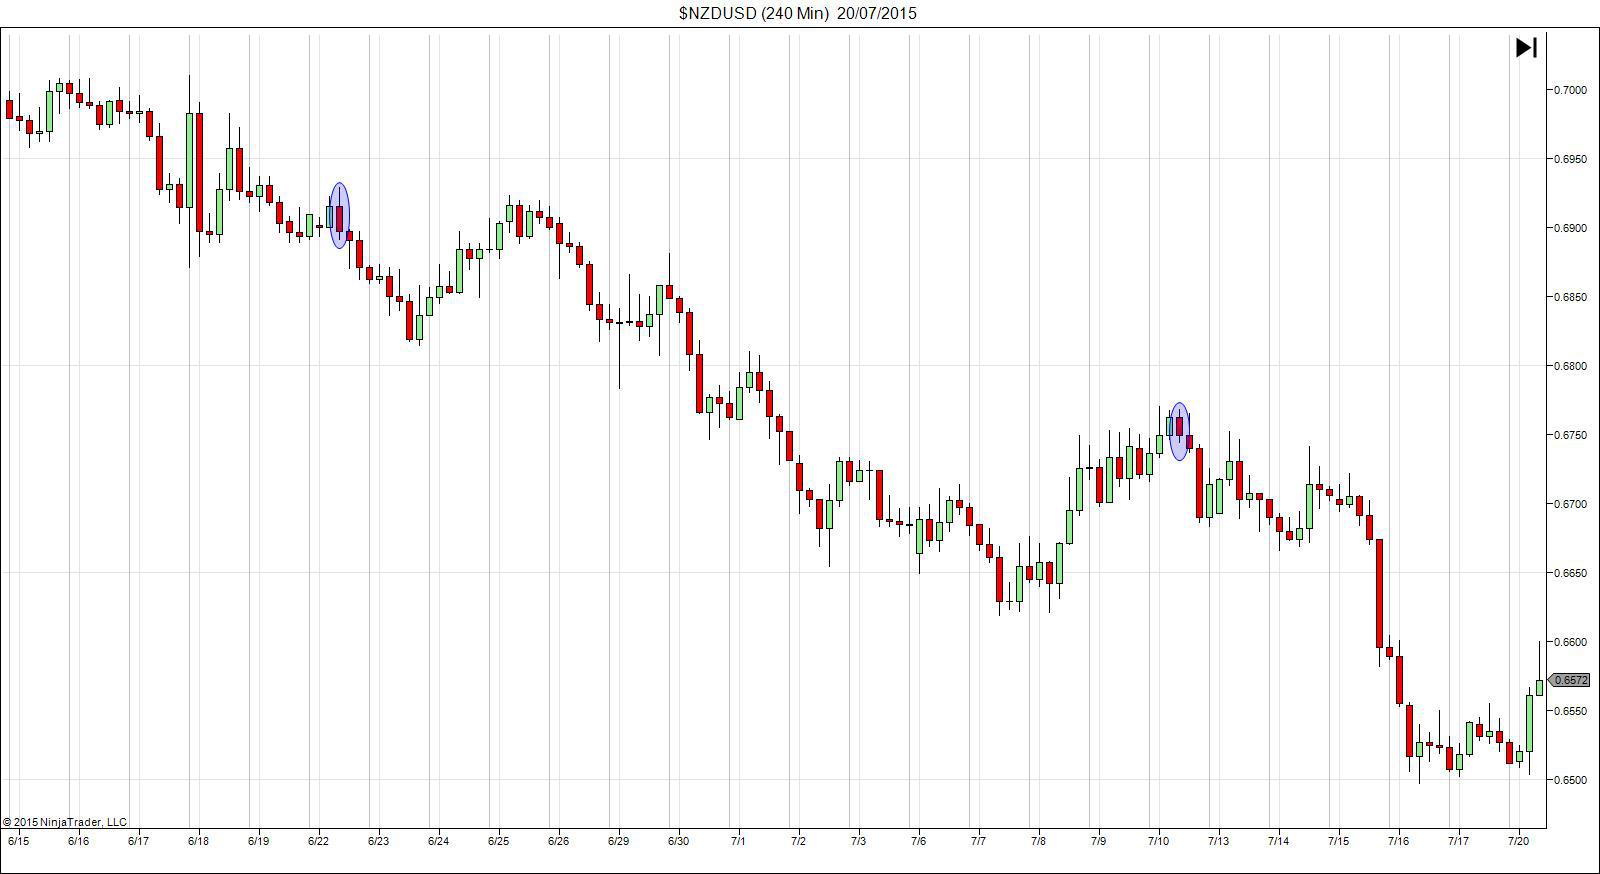
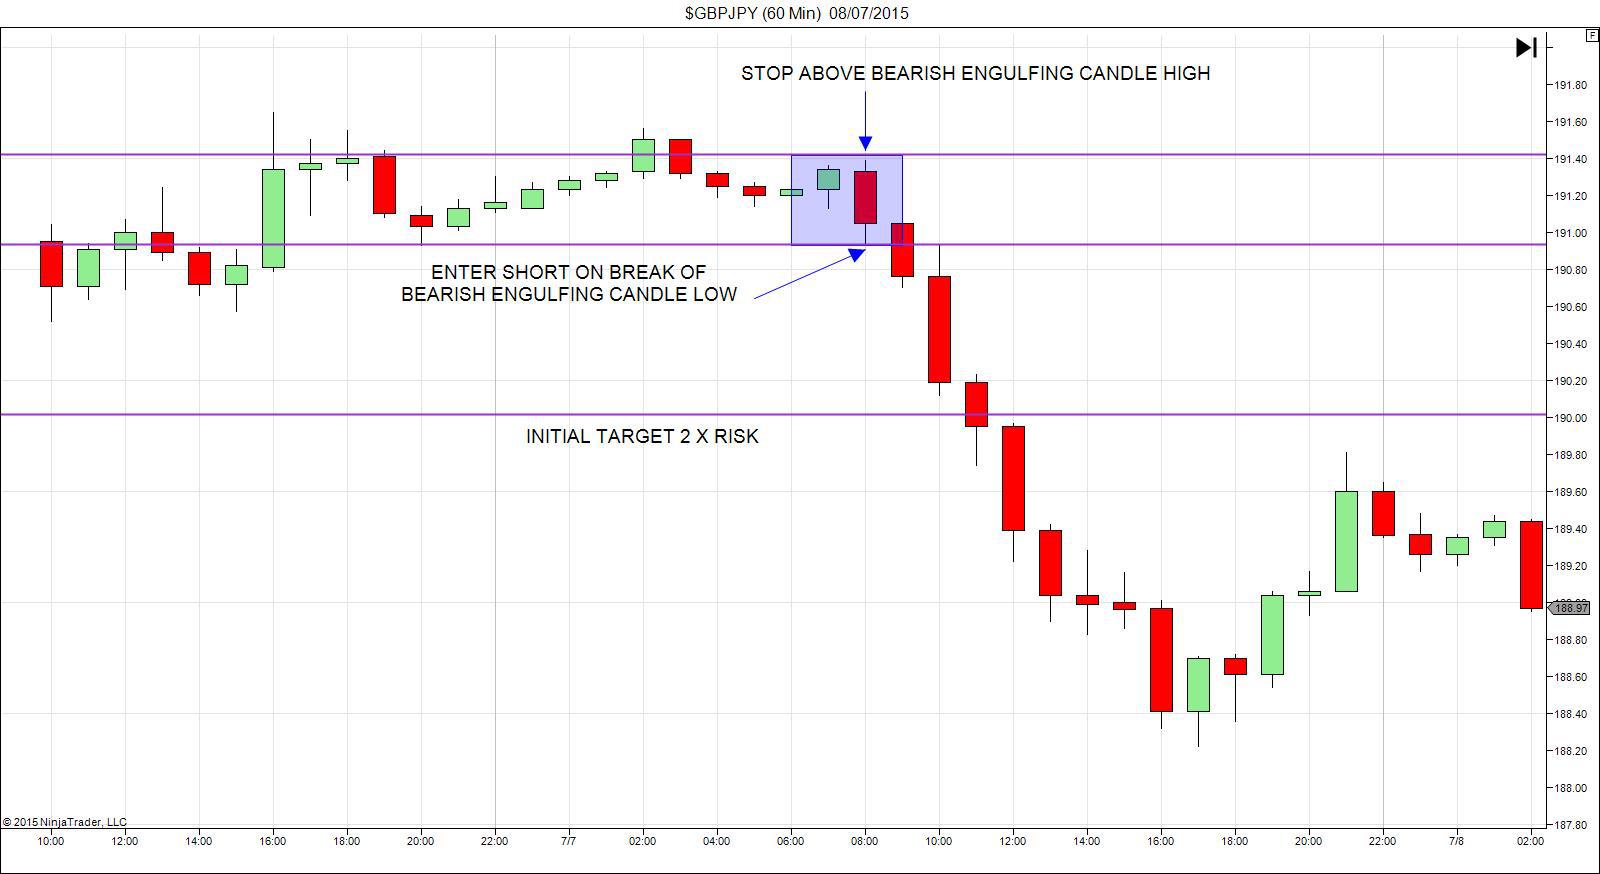
Like Pin Bars, the real trick to this is to look for obvious signals, the ones that really stand out. For instance, if you have an overall downtrend but have recently retraced higher, you will then get a nice Bearish engulfing which could be a great entry to join the trend lower.
As in the Pin Bar strategy, what we want to look for is the ability to place the stop above the Bearish engulfing high or below the Bullish engulfing low, and then look for at least 2:1 risk reward for the trend continuation.
All comments, charts and analysis on this website are purely provided to demonstrate our own personal thoughts and views of the market and should in no way be treated as recommendations or advice. Please do not trade based solely on any information provided within this site, always do your own analysis.
Editors’ Picks

EUR/USD flirts with daily highs, retargets 1.1900
EUR/USD regains upside traction, returning to the 1.1880 zone and refocusing its attention to the key 1.1900 barrier. The pair’s slight gains comes against the backdrop of a humble decline in the US Dollar as investors continue to assess the latest US CPI readings and the potential Fed’s rate path.

GBP/USD remains well bid around 1.3650
GBP/USD maintains its upside momentum in place, hovering around daily highs near 1.3650 and setting aside part of the recent three-day drop. Cable’s improved sentiment comes on the back of the Greenback’s irresolute price action, while recent hawkish comments from the BoE’s Pill also collaborate with the uptick.

USD/JPY edges up above 153.50 with all eyes on US CPI figures
USD/JPY appreciates above 153.00 but remains on track for a 2.4% weekly loss. Trading volumes remain subdued on Friday, ahead of the IS CPI release. The Yen remains supported by hopes of a stable government and calls for further BoJ tightening.
Editors’ Picks

EUR/USD: Yes, the US economy is resilient – No, that won’t save the US Dollar Premium
Some impressive US data should have resulted in a much stronger USD. Well, it didn’t happen. The EUR/USD pair closed a third consecutive week little changed, a handful of pips above the 1.1800 mark.

Gold: Metals remain vulnerable to broad market mood Premium
Gold (XAU/USD) started the week on a bullish note and climbed above $5,000 before declining sharply and erasing its weekly gains on Thursday, only to recover heading into the weekend.

GBP/USD: Pound Sterling remains below 1.3700 ahead of UK inflation test Premium
The Pound Sterling (GBP) failed to resist at higher levels against the US Dollar (USD), but buyers held their ground amid a US data-busy blockbuster week.

Bitcoin: BTC bears aren’t done yet
Bitcoin (BTC) price slips below $67,000 at the time of writing on Friday, remaining under pressure and extending losses of nearly 5% so far this week.

US Dollar: Big in Japan Premium
The US Dollar (USD) resumed its yearly downtrend this week, slipping back to two-week troughs just to bounce back a tad in the second half of the week.
RECOMMENDED LESSONS
Making money in forex is easy if you know how the bankers trade!
I’m often mystified in my educational forex articles why so many traders struggle to make consistent money out of forex trading. The answer has more to do with what they don’t know than what they do know. After working in investment banks for 20 years many of which were as a Chief trader its second knowledge how to extract cash out of the market.
5 Forex News Events You Need To Know
In the fast moving world of currency markets where huge moves can seemingly come from nowhere, it is extremely important for new traders to learn about the various economic indicators and forex news events and releases that shape the markets. Indeed, quickly getting a handle on which data to look out for, what it means, and how to trade it can see new traders quickly become far more profitable and sets up the road to long term success.
Top 10 Chart Patterns Every Trader Should Know
Chart patterns are one of the most effective trading tools for a trader. They are pure price-action, and form on the basis of underlying buying and selling pressure. Chart patterns have a proven track-record, and traders use them to identify continuation or reversal signals, to open positions and identify price targets.
7 Ways to Avoid Forex Scams
The forex industry is recently seeing more and more scams. Here are 7 ways to avoid losing your money in such scams: Forex scams are becoming frequent. Michael Greenberg reports on luxurious expenses, including a submarine bought from the money taken from forex traders. Here’s another report of a forex fraud. So, how can we avoid falling in such forex scams?
What Are the 10 Fatal Mistakes Traders Make
Trading is exciting. Trading is hard. Trading is extremely hard. Some say that it takes more than 10,000 hours to master. Others believe that trading is the way to quick riches. They might be both wrong. What is important to know that no matter how experienced you are, mistakes will be part of the trading process.
The challenge: Timing the market and trader psychology
Successful trading often comes down to timing – entering and exiting trades at the right moments. Yet timing the market is notoriously difficult, largely because human psychology can derail even the best plans. Two powerful emotions in particular – fear and greed – tend to drive trading decisions off course.