The use of Fibonacci levels in trading is perhaps one the best examples of the core philosophy of Technical Analysis and the belief of many, that trading decisions can be made purely from studying the charts and without the need for Fundamental Analysis.
Without giving you a history lesson on Fibonacci and his importance in mathematics we will focus solely on how Fibonacci levels are used in trading.
Fibonacci numbers, when used to measure price swings in the markets, present powerful levels to watch for potential reversals and are applied in technical analysis through two main studies: Fibonacci retracement and Fibonacci expansion.
Fibonacci Retracement
The retracement tool is used to measure a move in price and identify areas to look for price to retrace into with a view to reversing and continuing in the direction of the primary move and is a popular method amongst trend-traders looking to enter on a pullback to trade a resumption of the trend.
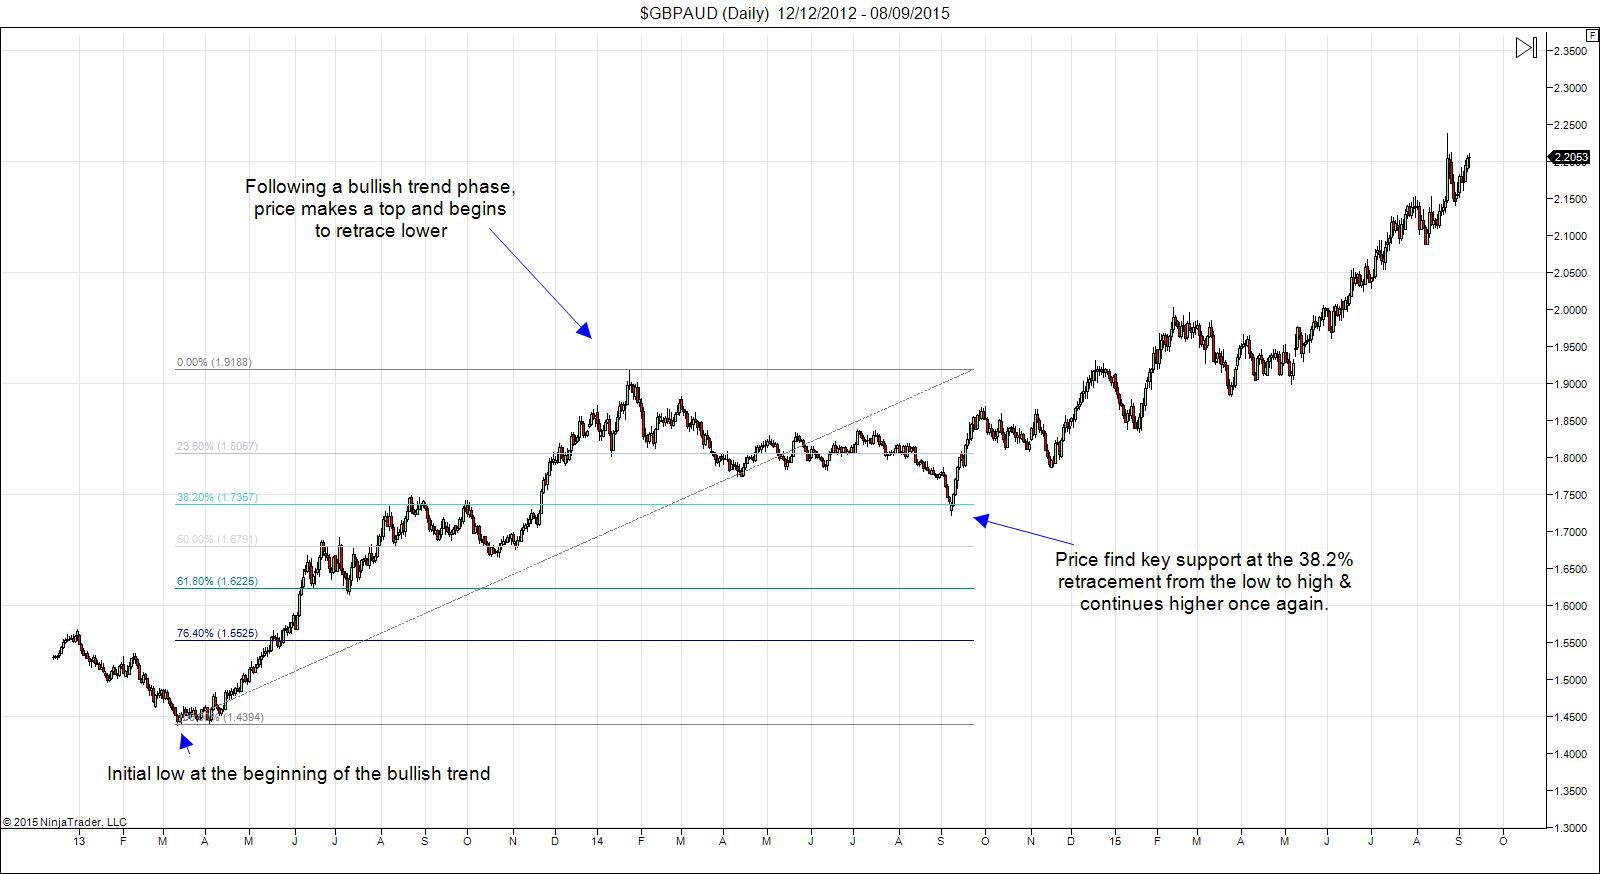
In the example above we can see that GBPAUD enjoyed a sustained bullish trend before it began to retrace and move lower (known as a correction). Applying a Fibonacci retracement tool from the low to the initial high point, we can see that price sold off 38.2% of its gains before reversing and resuming the bullish trend.
Why is is that Fibonacci levels work?
Some argue that it is due to the core mathematical principles underpinning Fibonacci numbers and their relation to the natural geometrical structures found throughout nature, whilst others argue it is simply due to crowd mentality and the fact that as so many traders watch these levels and anticipate their response, they have become a kind of “self-fulfilling prophecy”.
So which is true? well, probably a bit of both, but the important point is that we don’t need to know for certain why it is they work just that they tend to.
A key consideration here is that we can never know for certain which Fibonacci level will yield a reversal, or indeed if any will, but they are powerful levels to identify and monitor because of how often they tend to work. It is certainly not advisable to simply trade the level expecting a reversal but where we can find Fibonacci levels that line up around key structural points, such as support/resistance formed from previous highs and lows, this increases the chance of the level holding.
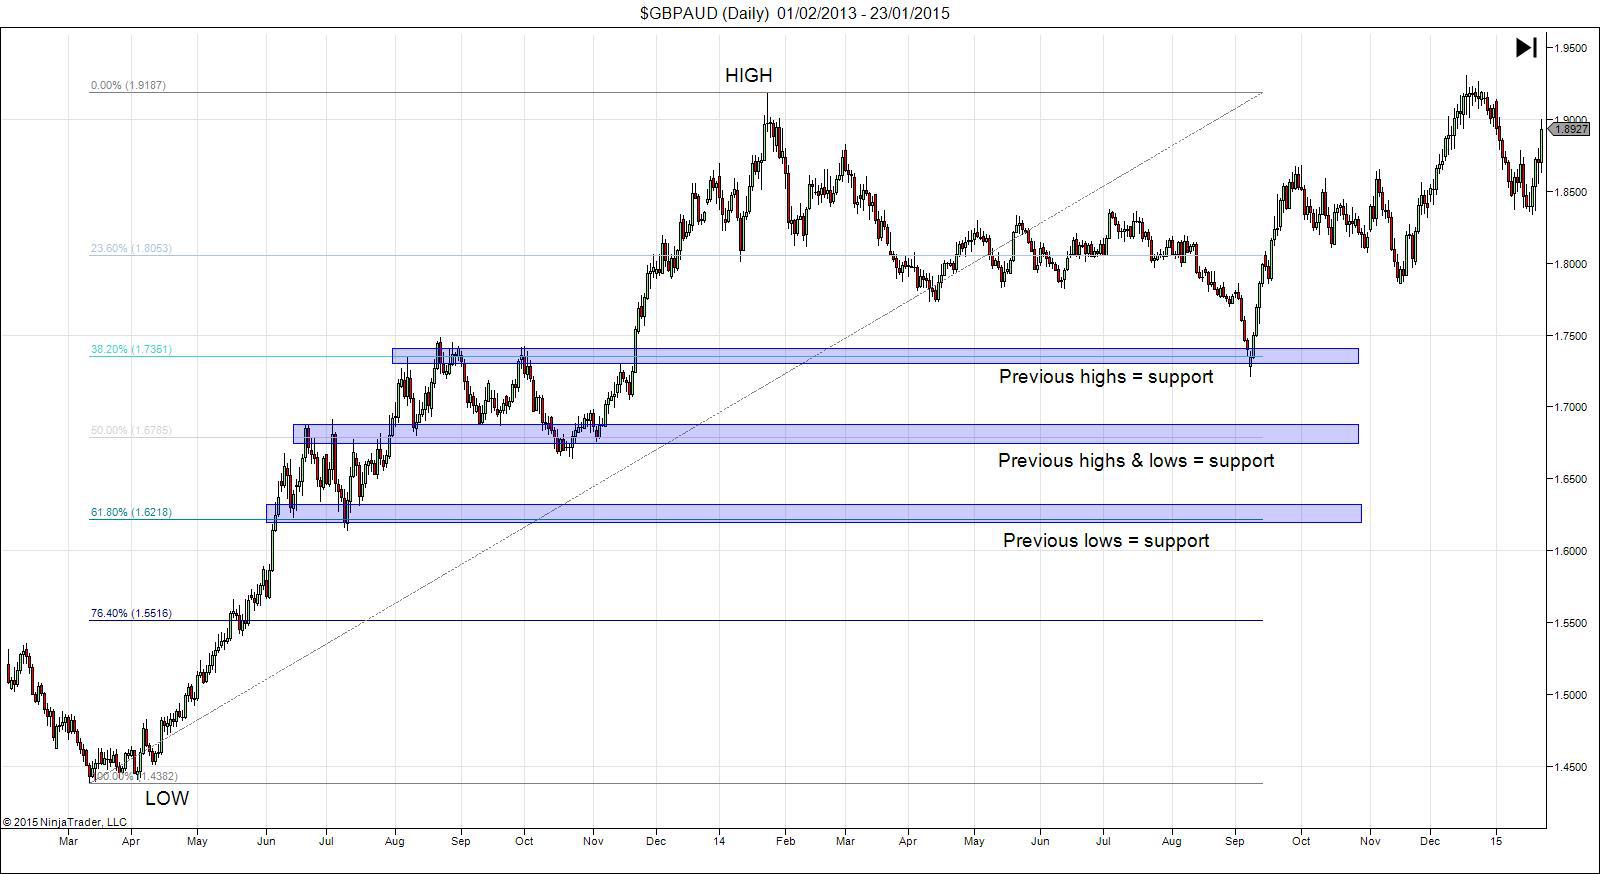
Looking at the above example again we can see that the 38.2% retracement lined up with former broken highs offering strong support. The 50% & 61.8% retracement levels also lined up with key structural levels.
Another way to find levels with an increased likelihood of holding is to find technical confluence such as looking to identify indicator divergence into key Fibonacci levels or identifying price action patterns that suggest a reversal.
A really simple way to identify confluence is simply to use the Fibonacci tool to itself and measure different swings to find levels that coincide as these tend to be the most powerful.
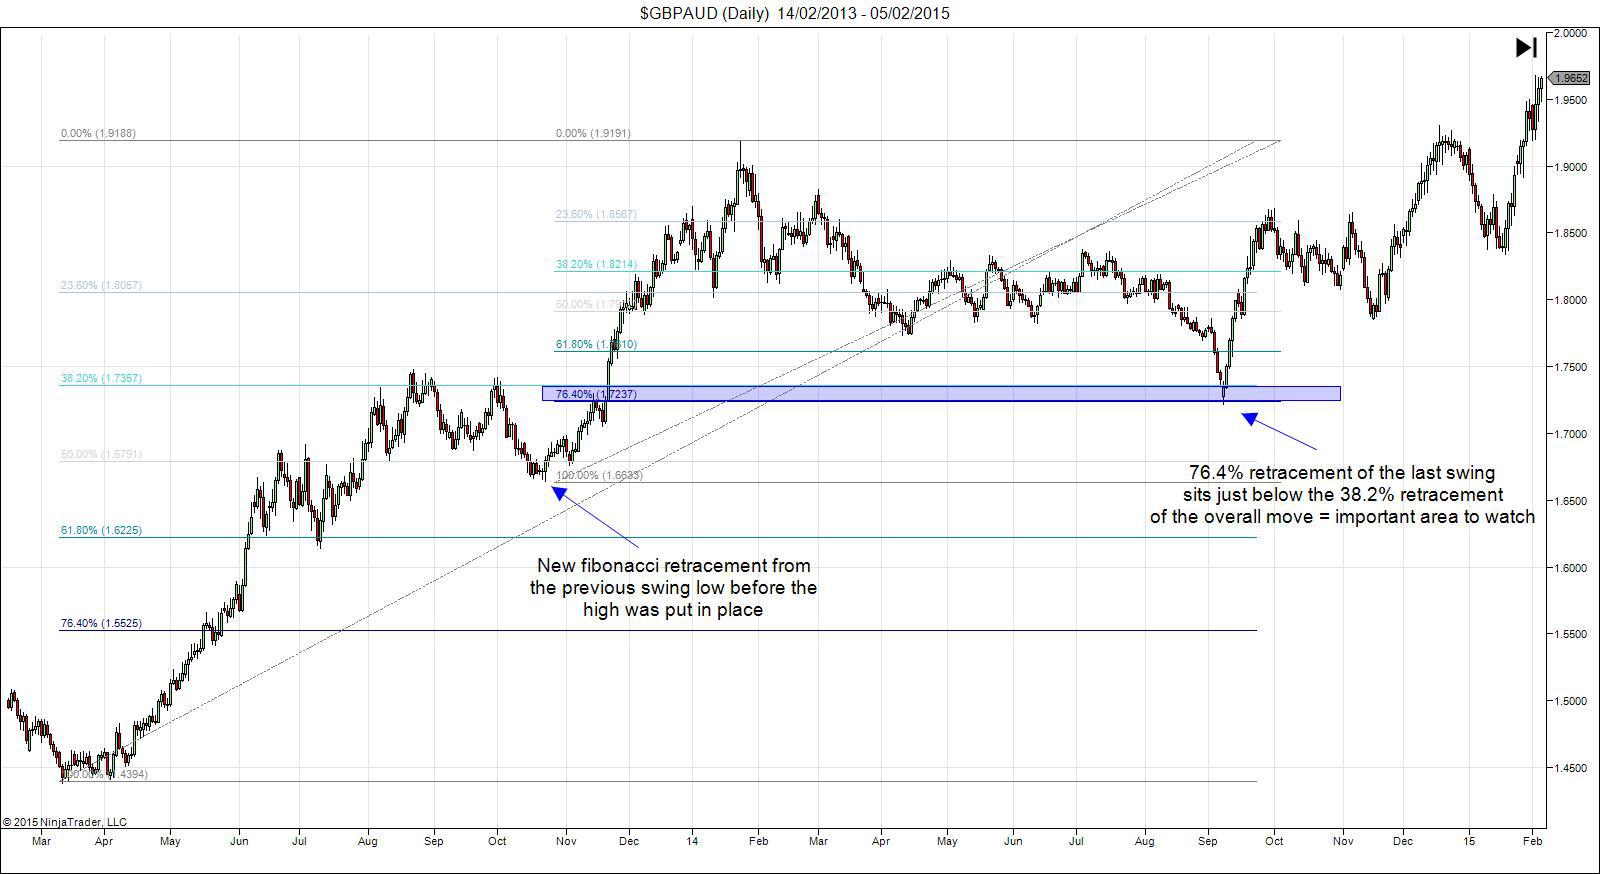
In the example above we can see that if we use the Fibonacci retracement tool to measure the last swing made into the high, the 78.4% retracement sits just below the 38.2% retracement of the overall move creating a powerful zone to watch for potential reversals.
Using this method of measuring various swing points to find confluence of Fibonacci retracement levels is a really great way to identify potential trade zones.
They key Fibonacci retracement levels to monitor are
0%
23.6%
38.2%
50%
61.8%
76.4%
100%
Fibonacci Expansion
Whereas Fibonacci retracement measures a move to find levels to look for price to retrace into, Fibonacci expansion measures a move to project levels in the direction of the primary move that price is likely to move into in future.
The Fibonacci extension tool has 3 points instead of 2. Using the bullish example from above we measure first from low to high and then also to retracement low.
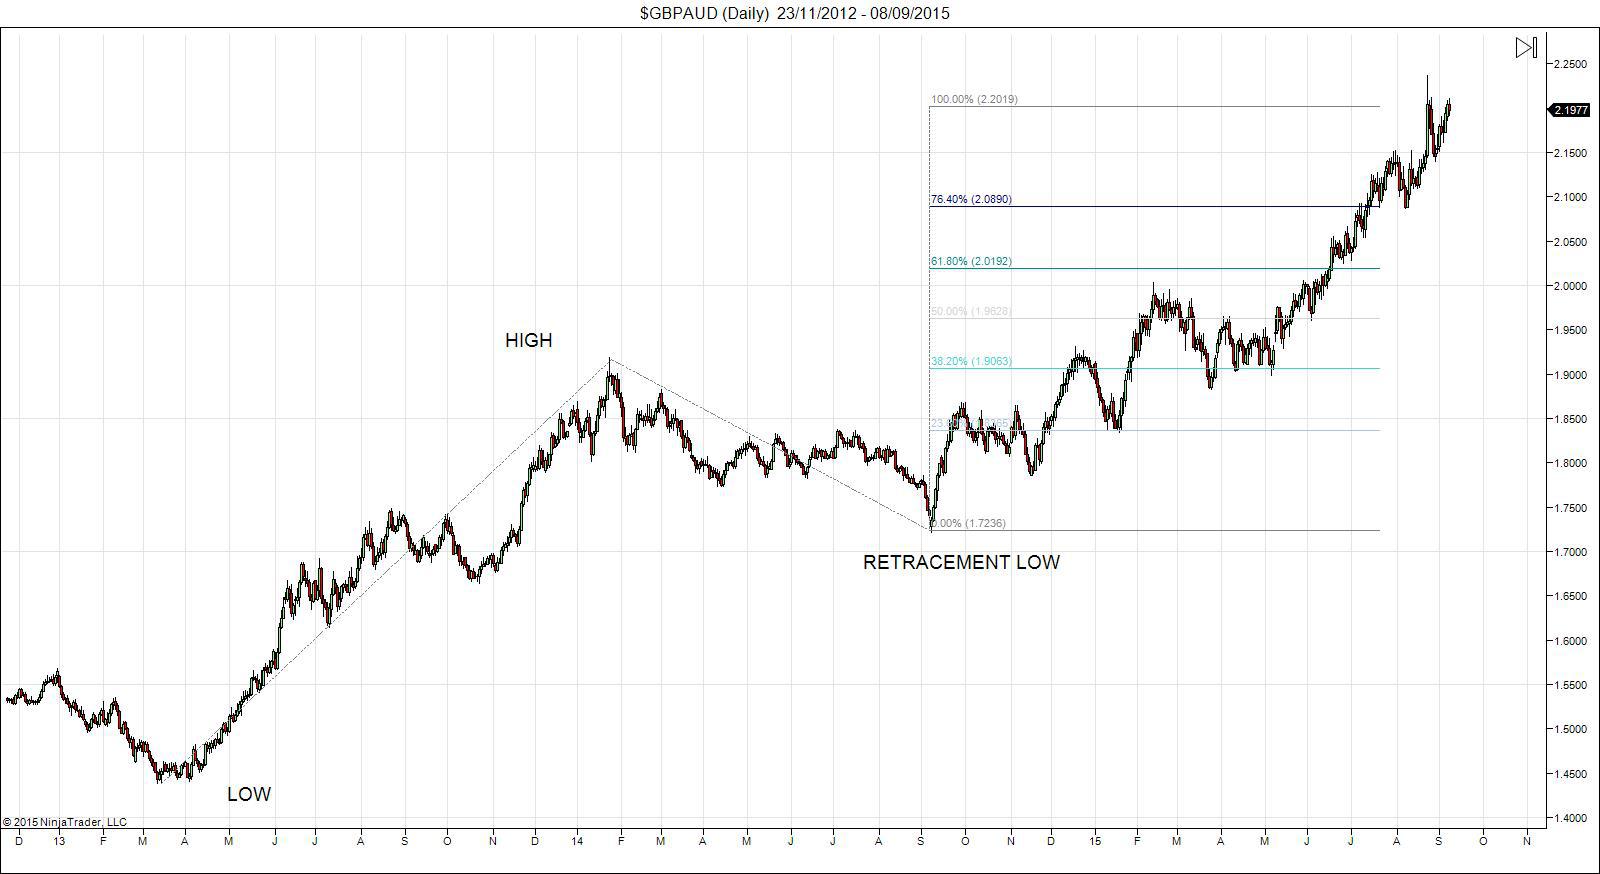
In the above example we can see the Fibonacci expansion levels marked on the chart from applying the tool to the high, low and retracement low. Price has already hit these levels but at the the time that price was moving up from the retracement low these would have been fresh levels in the market (future levels) that we would monitor.
So how do you use Fibonacci expansion levels?
Well if we were trading that bullish trend for example and had entered on the retracement to the 38.2% level, we could monitor these levels as potential take-profit targets again looking for indicator or price action divergence to suggest the level we should take profit at.
The most important expansion level is the 100% which tends to offer the strongest reaction.
Again however we can use the Fibonacci tools themselves to identify confluence. This time we can use a combination of retracement and expansion to identify key levels.
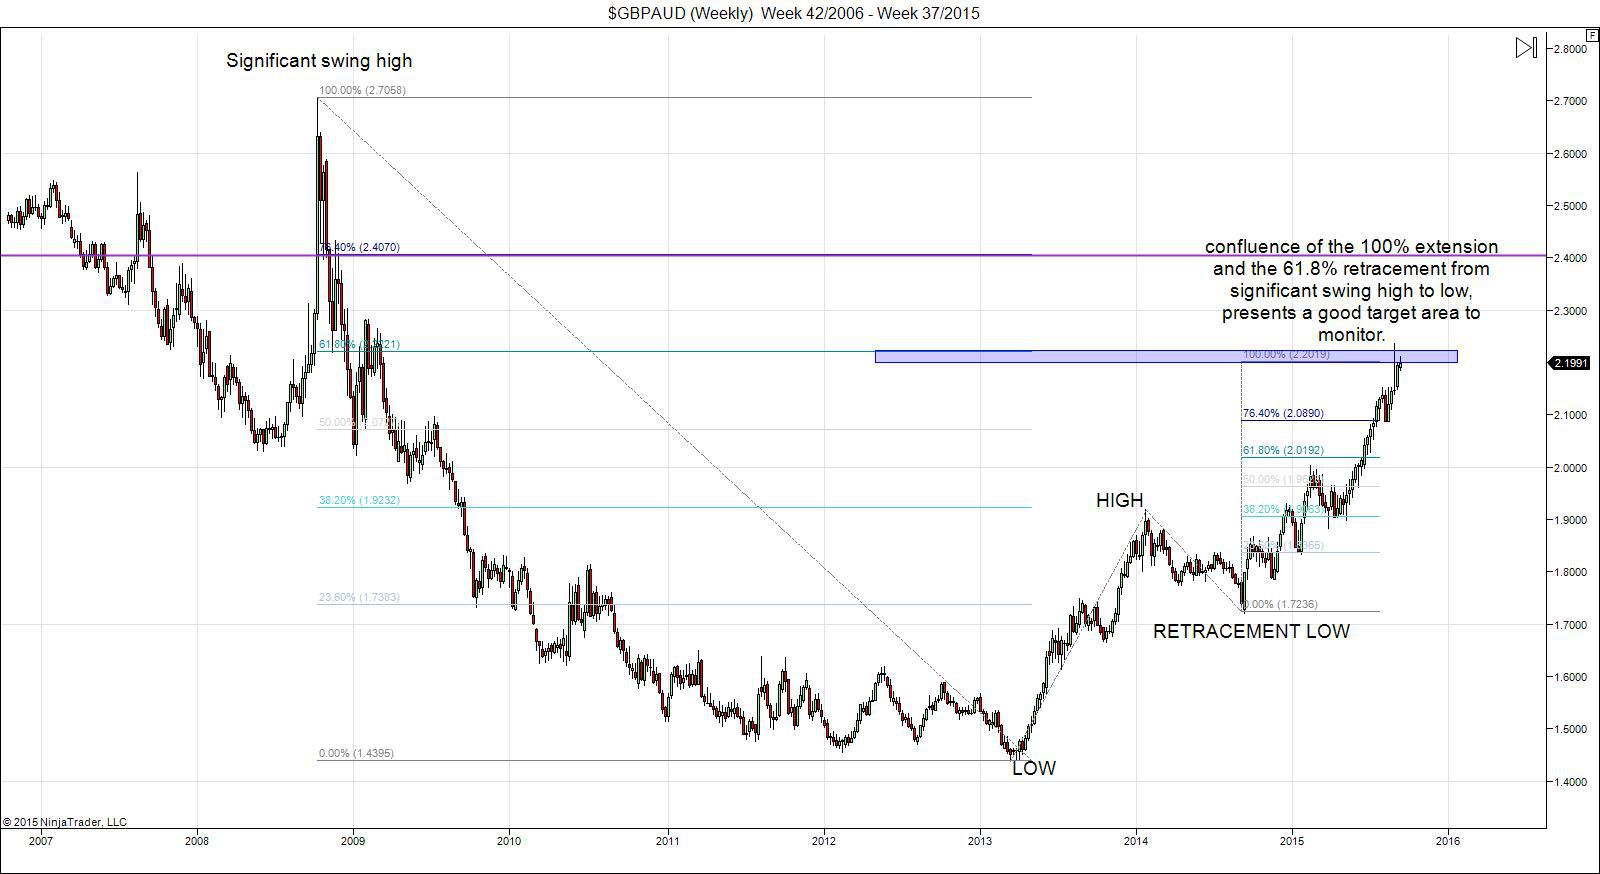
In the example above we can see that if we zoom out on our chart and look to find the last significant swing high point before the low was made at the start of the bullish trend we are in, we can apply our retracement tool.
The 61.8% retracement from that significant high sits nicely with the 100% expansion level of our primary bullish move and as such would be a great area to monitor as a potential target.
Hopefully the examples and explanations above have opened your eyes to the power of Fibonacci levels in trading. As with all technical analysis it is simply a question of getting used to the methods and becoming more competent and confident with them. Make sure you only stick to significant swing points and begin on the Daily & Weekly charts to start with. If you have to ask yourself “is this a significant swing point?” then it probably isn’t – just stick to the obvious ones to start with.
Once you start to combine some price action analysis or combine indicators with these Fibonacci levels you can create some really profitable trading opportunities.
This market forecast is for general information only. It is not an investment advice or a solution to buy or sell securities.
Authors' opinions do not represent the ones of Orbex and its associates. Terms and Conditions and the Privacy Policy apply.
Trading foreign exchange on margin carries a high level of risk, and may not be suitable for all investors. Before deciding to trade foreign exchange, you should carefully consider your investment objectives, level of experience, and risk appetite. There is a possibility that you may sustain a loss of some or all of your investment and therefore you should not invest money that you cannot afford to lose. You should be aware of all the risks associated with foreign exchange trading, and seek advice from an independent financial advisor if you have any doubts.
Editors’ Picks

EUR/USD recedes to daily lows near 1.1770
EUR/USD is losing some momentun, easing to daily troughs around 1.1770 on turnaround Tuesday. The pair’s pullback comes amid solid gains in the US Dollar, all amid lingering uncertainty around US tariffs ahead of comments from Fed officials.

GBP/USD comes under pressure below 1.3500, focus on BoE
GBP/USD is on the defensive again on Tuesday, hovering below the 1.3500 mark as the Greenback stages a firm rebound after two soft sessions. Investors, in the meantime, are expected to closely follow BoE official’s comments later in the day.

USD/JPY climbs to 156.00 area as markets doubt BoJ rate hikes
USD/JPY catches a fresh bid wave and challenges the 156.00 region on Tuesday. The pair rallies as the Japanese Yen (JPY) falls hard on reports that Japan's PM Takaichi voiced concerns to BoJ Governor Ueda on interest rate hikes.
Editors’ Picks
EUR/USD recedes to daily lows near 1.1770
EUR/USD is losing some momentun, easing to daily troughs around 1.1770 on turnaround Tuesday. The pair’s pullback comes amid solid gains in the US Dollar, all amid lingering uncertainty around US tariffs ahead of comments from Fed officials.
USD/JPY climbs to 156.00 area as markets doubt BoJ rate hikes
USD/JPY catches a fresh bid wave and challenges the 156.00 region on Tuesday. The pair rallies as the Japanese Yen (JPY) falls hard on reports that Japan's PM Takaichi voiced concerns to BoJ Governor Ueda on interest rate hikes.

Gold fades the advance, back to $5,100
Gold is giving back a good portion of the recent multi-day rally, receding to the boundaries of the $5,100 region per troy ounce amid the marked rebound in the Greenback. In the meantime, markets’ attention remain on upcoming comments from Fed speakers.

Crypto Today: Bitcoin, Ethereum, XRP come under renewed pressure amid ETF outflows, tariff uncertainty
Bitcoin, Ethereum and Ripple are trading under increasing selling pressure at the time of writing on Tuesday, as market participants navigate renewed tariff uncertainty. The Crypto King holds above $63,000, down 2% intraday from its $64,656 open.

The Citrini report: How a debatable AI narrative can shake Wall Street Premium
That AI-related headline alone was enough to rattle investors.US stocks slid sharply on Monday after a widely circulated Citrini Research memo outlined a hypothetical “2028 Global Intelligence Crisis”, warning that rapid AI adoption could push US unemployment into double digits as early as by mid-2028.
RECOMMENDED LESSONS
Making money in forex is easy if you know how the bankers trade!
I’m often mystified in my educational forex articles why so many traders struggle to make consistent money out of forex trading. The answer has more to do with what they don’t know than what they do know. After working in investment banks for 20 years many of which were as a Chief trader its second knowledge how to extract cash out of the market.
5 Forex News Events You Need To Know
In the fast moving world of currency markets where huge moves can seemingly come from nowhere, it is extremely important for new traders to learn about the various economic indicators and forex news events and releases that shape the markets. Indeed, quickly getting a handle on which data to look out for, what it means, and how to trade it can see new traders quickly become far more profitable and sets up the road to long term success.
Top 10 Chart Patterns Every Trader Should Know
Chart patterns are one of the most effective trading tools for a trader. They are pure price-action, and form on the basis of underlying buying and selling pressure. Chart patterns have a proven track-record, and traders use them to identify continuation or reversal signals, to open positions and identify price targets.
7 Ways to Avoid Forex Scams
The forex industry is recently seeing more and more scams. Here are 7 ways to avoid losing your money in such scams: Forex scams are becoming frequent. Michael Greenberg reports on luxurious expenses, including a submarine bought from the money taken from forex traders. Here’s another report of a forex fraud. So, how can we avoid falling in such forex scams?
What Are the 10 Fatal Mistakes Traders Make
Trading is exciting. Trading is hard. Trading is extremely hard. Some say that it takes more than 10,000 hours to master. Others believe that trading is the way to quick riches. They might be both wrong. What is important to know that no matter how experienced you are, mistakes will be part of the trading process.
The challenge: Timing the market and trader psychology
Successful trading often comes down to timing – entering and exiting trades at the right moments. Yet timing the market is notoriously difficult, largely because human psychology can derail even the best plans. Two powerful emotions in particular – fear and greed – tend to drive trading decisions off course.