EUR/USD Current Price: 1.0930
View Live Chart for the EUR/USD
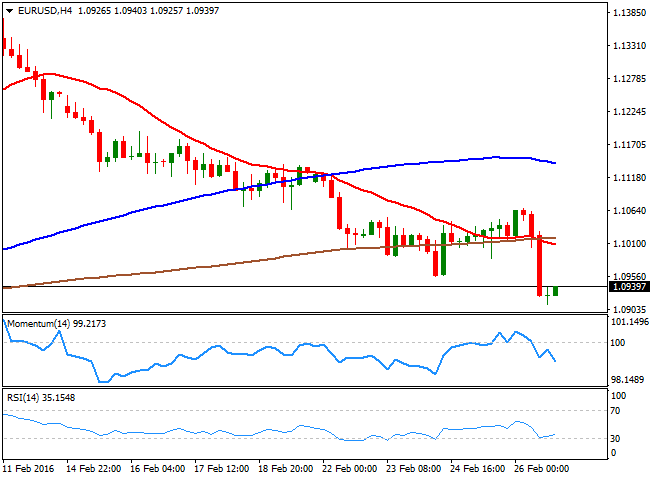
The American dollar closed the week broadly higher across the board, boosted by a strong upward revision of the Q4 2015 GDP. Initially estimated at 0.7%, the first review of the figure came in at 1.0%, surpassing expectations of 0.4%. The EUR/USD pair plummeted towards the 1.0900 region, with the common currency hurt earlier in the week by poor PMIs figures across the region. Overall, seems the greenback is poised to extend its advance, supported additionally by the turmoil affecting the different economies.
As for the technical picture, the daily chart presents a clear bearish bias, as the price has accelerated its decline below its 20 SMA, whilst being capped by the 200 SMA for most of this past week. The 100 SMA in the same chart is the last standing man, around 1.0895, the immediate support for this week. In the same chart, the technical indicators head firmly lower within bearish territory, indicating a continued decline is most likely. Shorter term, the 4 hours chart shows that the price remains near its Friday low at 1.0911, and below its moving averages, while the Momentum indicator continues heading south. The RSI indicator in this last time frame has posted a tepid bounce from oversold readings, but rather reflecting the latest recovery than suggesting an upward move in the short term. Some intraday lows around 1.0960 should offer resistance in the case of further advances, with a clear recovery above the level required to support the upward correction case.
Support levels: 1.0895 1.0850 1.0810
Resistance levels: 1.0960 1.1000 1.1045
EUR/JPY Current price: 124.64
View Live Chart for the EUR/JPY
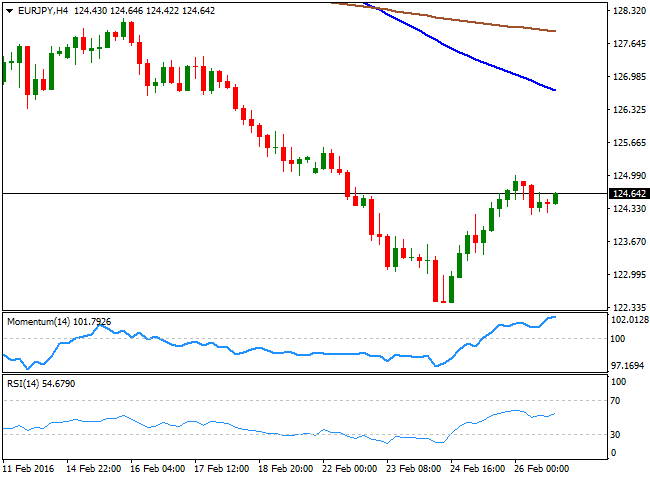
The EUR/JPY pair closed in the red for a fourth week in-a-row, although it managed to trim most of its weekly losses on the back of yen weakness. The Japanese currency has retained part of its recent strength, in spite of the negative deposit rates announced by the BOJ in its latest attempt to boost inflation, mostly due to its safe-haven condition. Markets, however, seem to be rethinking their positions on the currency, on hopes the Central Bank will continue to act, although the EUR is also among the weakest currencies of the board, which means the pair will likely lack clear direction. Technically, the daily chart suggests an interim bottom may be under way at 122.43, although some further advances beyond 126.00 are required to confirm a more sustainable recovery, given that the technical indicators have corrected extreme oversold readings, but remain far from showing upward strength. In the shorter term, the 4 hours chart shows that the 100 SMA continues extending below the 200 SMA, both well above the current price zone, whilst the technical indicators have lost upward potential, but remain within bullish territory, supporting some gains for this Monday.
Support levels: 124.20 123.75 123.30
Resistance levels: 125.10 125.60 126.20
GBP/USD Current price: 1.3863
View Live Chart for the GBP/USD
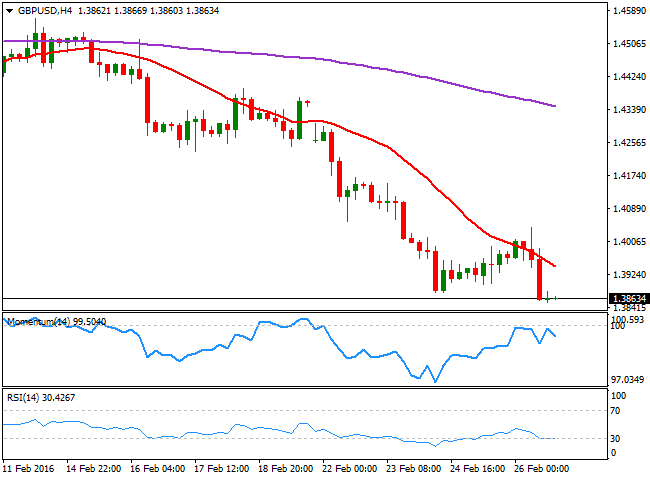
The British Pound shed over 3% against the greenback last week, breaking below the 1.400 figure for the first time since March 2009, on mounting concerns over the UK referendum on its EU membership, which has been set for June 23rd. Mid February, the EU reform deal was expected to ease the pressure over a possible Brexit, but concerns returned last week, whilst the strong US GDP upward revision did the rest. The GBP/USD pair is currently trading at 1.3863, a handful of pips above the multi-year low set at 1.3852, maintaining a strong negative technical tone. Done for a second week in-a-row, the daily chart shows that the technical indicators maintain their bearish momentum, despite being in oversold territory, whilst the 20 SMA has turned south, but far above the current level, around 1.4320. In the 4 hours chart, a sharply bearish 20 SMA continues leading the way south, offering a dynamic resistance, now around 1.3940, whilst the Momentum indicator has been rejected from its 100 level and the RSI indicator consolidates in oversold territory, all of which supports the longer term outlook.
Support levels: 1.3850 1.3315 1.3770
Resistance levels: 1.3895 1.3940 1.3985
USD/JPY Current price: 113.92
View Live Chart for the USD/JPY
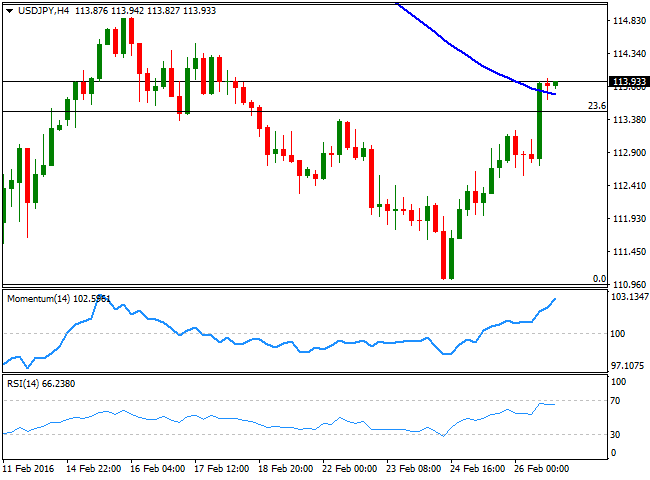
The USD/JPY pair closed the week with nice gains at 113.93, helped by positive US data, which sent risk-aversion trading to the backstage. Nevertheless, the pair is far from recovering its post-BOJ's losses, as it remains well below the 38.2% retracement of such slump, at 115.05. Also, helping the pair's advance is renewed speculation that the Japanese Central Bank may announce further stimulus measures during its upcoming meetings. From a technical point of view, the daily chart shows a double floor developing, with the neckline at February 16th daily high at 114.87. With the mentioned Fibonacci resistance barely above this last, seems that a recovery above the mentioned 115.05 level is required to confirm additional gains, during this week. The technical indicators in the same chart, head higher, with only the Momentum indicator above its mid-line, whilst the 100 and 200 SMAs are far away above the current level, all of which suggests that the upside is still limited. According to the 4 hours chart however, the upside seems more constructive, with the price above its 100 SMA for the first time since early February, and the technical indicators nearing overbought territory, in line with further short term gains.
Support levels: 113.50 113.10 112.75
Resistance levels: 114.60 115.05 115.50
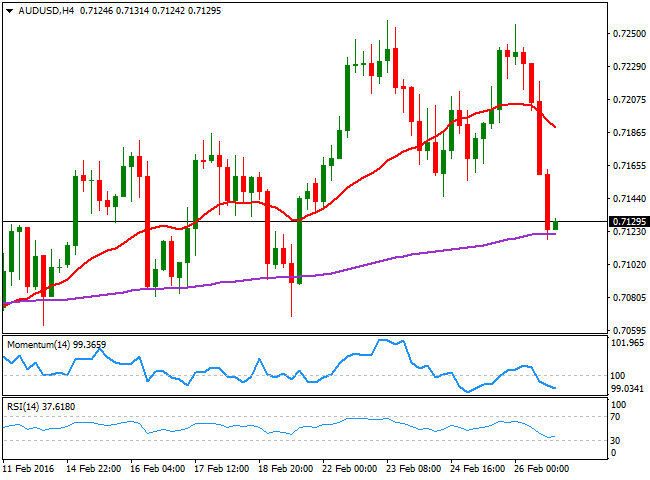
AUD/USD Current price: 0.7129
View Live Chart for the AUD/USD
The Aussie plummeted last Friday, ending the week practically unchanged at 0.7129 against the greenback. A recovery in base metals helped the commodity-related currency to advance up to 0.7255 last week, but better-than-expected US GDP figures were enough to erase all of the pair's weekly gains. During the upcoming days, Australia will release its own GDP data regarding the last quarter of 2015, while the RBA will have its monthly economic policy meeting, both set to determinate the future of the local currency that, despite this latest slide, maintains a positive tone, ever since bottoming near 0.6800 at the beginning of the year. From a technical point of view, the daily chart shows that the pair closed the day right below its 20 SMA for the first time since mid January, whilst the technical indicators turned south above their mid-lines, still not confirming a downward continuation, but increasing the risk of such move. In the 4 hours chart, the price has met some short term buying interest around the 200 EMA, currently at 0.7115, although the general tone is bearish as the price is now below its 20 SMA whilst the technical indicators head lower within negative territory. Risk towards the downside will likely accelerate on a break below the 0.7115 level, with further declines seen on a downward acceleration below 0.7070.
Support levels: 0.7115 0.7070 0.7025
Resistance levels: 0.7145 0.7190 0.7240
Information on these pages contains forward-looking statements that involve risks and uncertainties. Markets and instruments profiled on this page are for informational purposes only and should not in any way come across as a recommendation to buy or sell in these assets. You should do your own thorough research before making any investment decisions. FXStreet does not in any way guarantee that this information is free from mistakes, errors, or material misstatements. It also does not guarantee that this information is of a timely nature. Investing in Open Markets involves a great deal of risk, including the loss of all or a portion of your investment, as well as emotional distress. All risks, losses and costs associated with investing, including total loss of principal, are your responsibility. The views and opinions expressed in this article are those of the authors and do not necessarily reflect the official policy or position of FXStreet nor its advertisers. The author will not be held responsible for information that is found at the end of links posted on this page.
If not otherwise explicitly mentioned in the body of the article, at the time of writing, the author has no position in any stock mentioned in this article and no business relationship with any company mentioned. The author has not received compensation for writing this article, other than from FXStreet.
FXStreet and the author do not provide personalized recommendations. The author makes no representations as to the accuracy, completeness, or suitability of this information. FXStreet and the author will not be liable for any errors, omissions or any losses, injuries or damages arising from this information and its display or use. Errors and omissions excepted.
The author and FXStreet are not registered investment advisors and nothing in this article is intended to be investment advice.
Recommended Content
Editors’ Picks
EUR/USD turns negative near 1.0760

The sudden bout of strength in the Greenback sponsored the resurgence of the selling pressure in the risk complex, dragging EUR/USD to the area of daily lows near 1.0760.
GBP/USD comes under pressure and challenges 1.2500

GBP/USD now rapidly loses momentum and gives away initial gains, returning to the 1.2500 region on the back of the strong comeback of the US Dollar.
Gold retreats from highs on stronger Dollar, yields

XAU/USD trims part of its initial advance in response to the jump in the Dollar's buying interest and the re-emergence of the upside pressure in US yields.
XRP tests support at $0.50 as Ripple joins alliance to work on blockchain recovery

XRP trades around $0.5174 early on Friday, wiping out gains from earlier in the week, as Ripple announced it has joined an alliance to support digital asset recovery alongside Hedera and the Algorand Foundation.
Week ahead – US inflation numbers to shake Fed rate cut bets

Fed rate-cut speculators rest hopes on US inflation data. After dovish BoE, pound traders turn to UK job numbers. Will a strong labor market convince the RBA to hike? More Chinese data on tap amid signs of slow Q2 start.
