EUR/USD Current price: 1.1126
View Live Chart for the EUR/USD

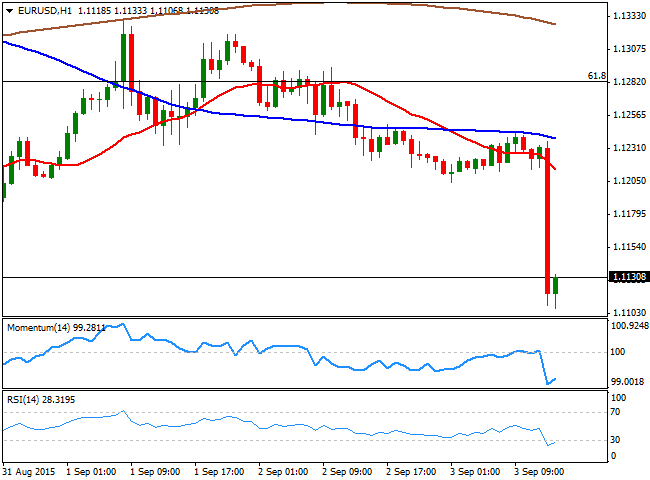
ECB's President, Mario Draghi, hammered the EUR by being far more dovish than what the market anticipated, triggering a 100 pips decline in the EUR/USD pair, down to 1.1106 so far today, a fresh 2-week low. The Central Bank lowered its growth and inflation forecasts as anticipated, and increased the issue share limit to 33% from previous 25%, although it will review it on a case-by-case basis. Additionally, the ECB indicated that it could expand its stimulus programs according to needs. With China representing no risk as per being close on holidays, European share markets are soaring alongside with a weaker EUR, and the 1 hour chart shows that the price has accelerated below its 20 and 100 SMAs, whilst the technical indicators reached oversold levels, where they stalled. In the 4 hours chart the bearish momentum is quite strong, although with US Nonfarm Payrolls in the way, the pair may enter in a consolidative stage from now on. Nevertheless the downside is favored with a break below 1.1100 exposing the 1.1050 price zone.
Support levels: 1.1100 1.1050 1.1010
Resistance levels: 1.1160 1.1200 1.1245
GBP/USD Current price: 1.5260
View Live Chart for the GPB/USD
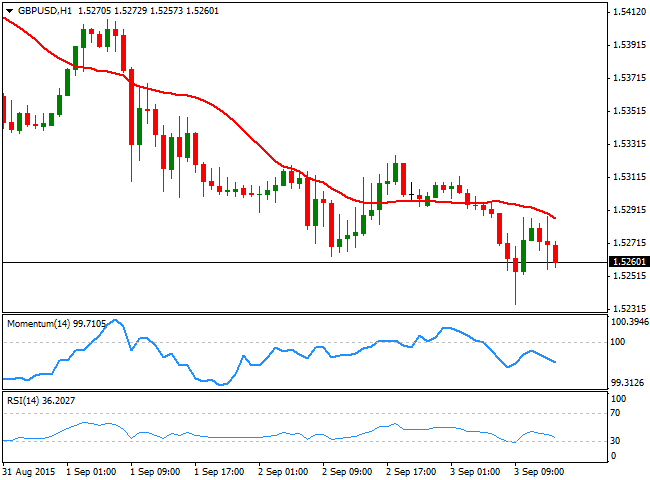
The GBP/USD maintains its bearish tone, trading near the daily low set at 1.5234 reached early Europe following the release of poor UK Markit services PMI for August. The pair saw a short lived spike on EUR/GBP slide following the ECB, but the 1 hour chart shows that the risk remains towards the downside as the 20 SMA capped the advance around 1.5290, whilst the technical indicators continue to head lower below their mid-lines. In the 4 hours chart the Momentum indicator extends to lower weekly lows below the 100 level, the RSI indicator hovers around oversold levels, whilst the 20 SMA maintains a strong bearish slope well above the current level, supporting further declines ahead, towards the 1.5200/20 price zone.
Support levels: 1.5250 1.5220 1.5170
Resistance levels: 1.5290 1.5330 1.5360
USD/JPY Current price: 119.84
View Live Chart for the USD/JPY
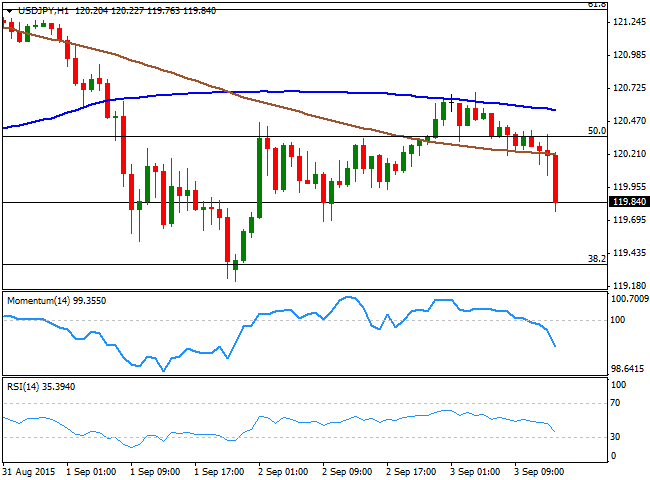
The USD/JPY pair came under selling pressure as the EUR/JPY sells off following the ECB dovish stance, breaking below the 120.00 level early in the US session. The USD/JPY has failed to hold beyond the 120.35 on a short term advance beyond it during Asian hours, and the 1 hour chart shows that the price is now accelerating below its 200 SMA, whilst the technical indicators head sharply lower below their mid-lines, anticipating a continued decline towards 119.40, the 38.2% retracement of the latest 2 weeks decline. In the 4 hours chart the technical picture is also bearish, although the decline can be limited on rising stocks and ahead of tomorrow US employment data.
Support levels: 119.40 118.90 118.50
Resistance levels: 120.00 120.35 120.60
Recommended Content
Editors’ Picks
EUR/USD holds below 1.0750 ahead of key US data

EUR/USD trades in a tight range below 1.0750 in the European session on Friday. The US Dollar struggles to gather strength ahead of key PCE Price Index data, the Fed's preferred gauge of inflation, and helps the pair hold its ground.
USD/JPY stays firm above 156.00 after BoJ Governor Ueda's comments

USD/JPY stays firm above 156.00 after surging above this level on the Bank of Japan's decision to leave the policy settings unchanged. BoJ Governor said weak Yen was not impacting prices but added that they will watch FX developments closely.
Gold price oscillates in a range as the focus remains glued to the US PCE Price Index

Gold price struggles to attract any meaningful buyers amid the emergence of fresh USD buying. Bets that the Fed will keep rates higher for longer amid sticky inflation help revive the USD demand.
Bitcoin Weekly Forecast: BTC’s next breakout could propel it to $80,000 Premium

Bitcoin’s recent price consolidation could be nearing its end as technical indicators and on-chain metrics suggest a potential upward breakout. However, this move would not be straightforward and could punish impatient investors.
US core PCE inflation set to signal firm price pressures as markets delay Federal Reserve rate cut bets

The core PCE Price Index, which excludes volatile food and energy prices, is seen as the more influential measure of inflation in terms of Fed positioning. The index is forecast to rise 0.3% on a monthly basis in March, matching February’s increase.