EUR/USD Current price: 1.1070
View Live Chart for the EUR/USD

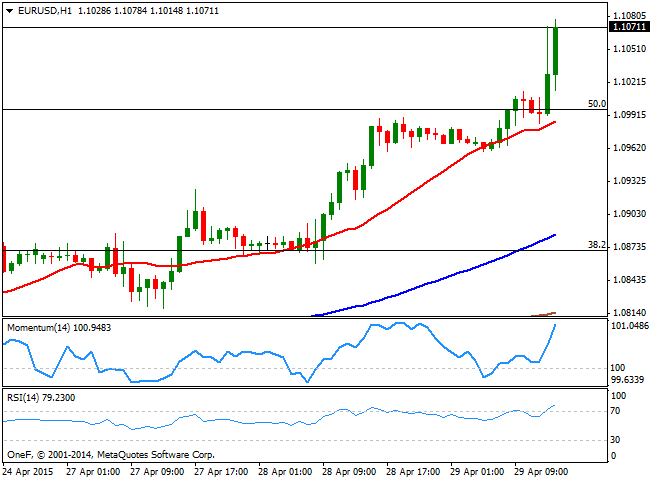
US GDP figures missed expectations, with growth in the first quarter sharply lower: the economy grew just 0.2% according to the first reading of the Q1 for 2015, driving the EUR/USD to a fresh monthly high on the 1.1070 area. The pair retreated from the level, but held well above the 1.1000 figure, now looking for fresh highs. Technically, the 1 hour chart shows that the technical indicators head strongly higher, with the RSI in extreme overbought territory, whilst the 20 SMA provides intraday support around 1.0990. In the 4 hours chart, the bias is also higher, despite indicators are in overbought territory, supporting additional advances up to the 1.1120 price zone.
Support levels: 1.1045 1.1000 1.0950
Resistance levels: 1.1085 1.1120 1.1160
GBP/USD Current price: 1.5409
View Live Chart for the GBP/USD
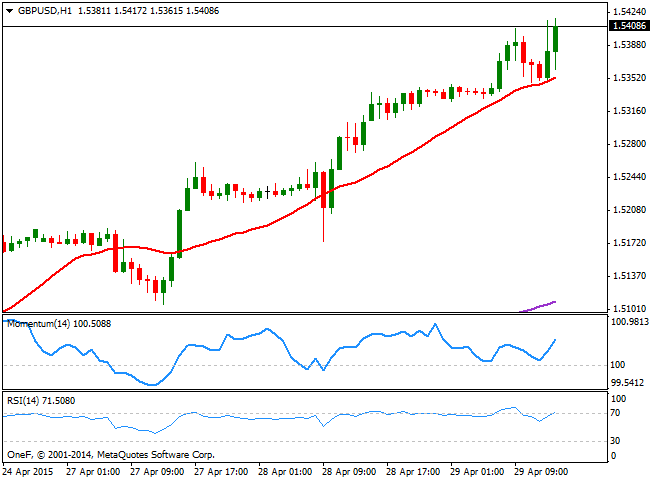
The GBP/USD extended its early advance to a fresh multi-week high after worse than expected US GDP figures, stabilizing above the 1.5400 level and with the 1 hour chart showing that the 20 SMA has been providing intraday support, now around 1.5350, whilst the technical indicators head sharply higher after correcting overbought levels. In the 4 hours chart the strong upward momentum prevails, with the RSI heading higher around 84 and the Momentum indicator also heading strongly up in overbought levels. The pair can now extend up to 1.5500, a critical resistance level.
Support levels: 1.5385 1.5340 1.5300
Resistance levels: 1.5430 1.5465 1.5500
USD/JPY Current price: 118.95
View Live Chart for the USD/JPY
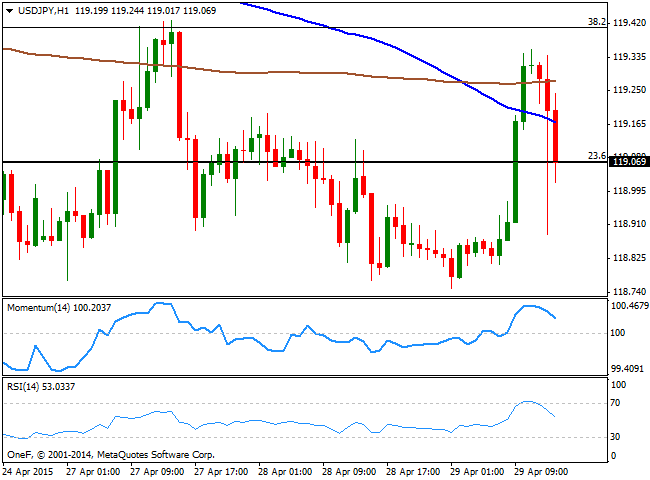
The USD/JPY pair trades around the 119.00 figure, having recovered from a low set at 118.88 following the macroeconomic news. The pair continues to lack directional strength, and the 1 hour chart shows that the price failed to run above its moving averages, whilst the technical indicators head sharply lower after reaching overbought territory. In the 4 hours chart indicators have turned lower around their mid-lines, albeit as long as between 118.50/120.00 playing the range is the only option.
Support levels: 118.50 118.10 117.70
Resistance levels: 119.10 119.50 120.00
AUD/USD Current price: 0.8032
View Live Chart for the AUD/USD
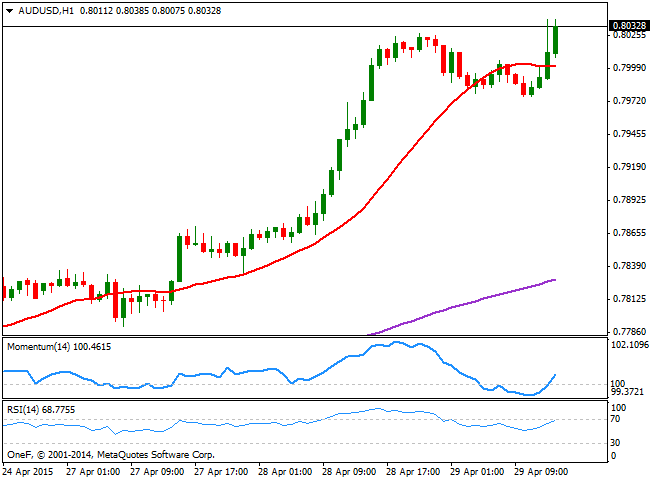
The AUD/USD trades above the 0.8000 level, maintaining the bullish potential seen earlier this week. The strong comeback in metals, with gold and iron-ore prices sharply higher on Tuesday, are supporting the Aussie, alongside with Chinese stimulus. Technically, the 1 hour chart shows that the price advances above its 20 SMA whilst the technical indicators crossed their mid-lines towards the upside, favoring the ongoing upward strength. In the 4 hours chart the technical indicators are also heading higher despite being in overbought territory, all of which suggest the pair can extend up to 0.8160 during the upcoming sessions, a key midterm resistance level.
Support levels: 0.7990 0.7940 0.7900
Resistance levels: 0.8065 0.8100 0.8130
Recommended Content
Editors’ Picks
EUR/USD edges lower toward 1.0700 post-US PCE

EUR/USD stays under modest bearish pressure but manages to hold above 1.0700 in the American session on Friday. The US Dollar (USD) gathers strength against its rivals after the stronger-than-forecast PCE inflation data, not allowing the pair to gain traction.
GBP/USD retreats to 1.2500 on renewed USD strength

GBP/USD lost its traction and turned negative on the day near 1.2500. Following the stronger-than-expected PCE inflation readings from the US, the USD stays resilient and makes it difficult for the pair to gather recovery momentum.
Gold struggles to hold above $2,350 following US inflation

Gold turned south and declined toward $2,340, erasing a large portion of its daily gains, as the USD benefited from PCE inflation data. The benchmark 10-year US yield, however, stays in negative territory and helps XAU/USD limit its losses.
Bitcoin Weekly Forecast: BTC’s next breakout could propel it to $80,000 Premium

Bitcoin’s recent price consolidation could be nearing its end as technical indicators and on-chain metrics suggest a potential upward breakout. However, this move would not be straightforward and could punish impatient investors.
Week ahead – Hawkish risk as Fed and NFP on tap, Eurozone data eyed too

Fed meets on Wednesday as US inflation stays elevated. Will Friday’s jobs report bring relief or more angst for the markets? Eurozone flash GDP and CPI numbers in focus for the Euro.