EUR/USD Current price: 1.0884
View Live Chart for the EUR/USD
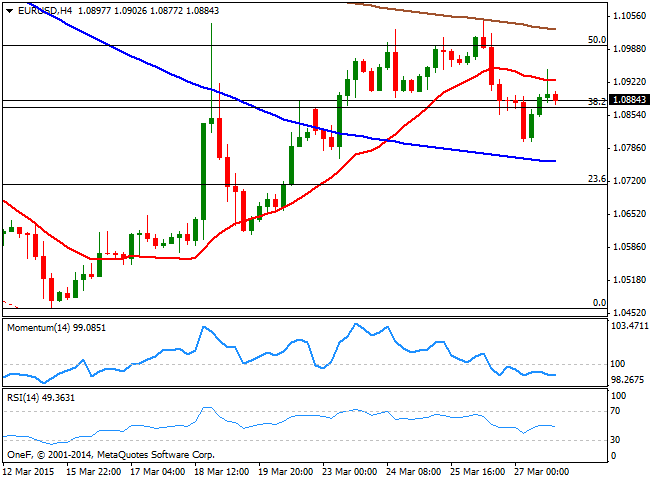
The EUR/USD surged up to 1.0940 late Friday, finding some late demand on the back of FED's Yellen conference about monetary policy, in where she remarked that rates will be gradually rose over the next few years, and that the tightening pace has not a preset course as it will be data dependant. Among other things, Yellen pointed to the job market as a key indicator, diminishing the importance of wage growth, as she stated that "we can never be sure what growth rate of nominal wages is consistent with stable consumer price inflation, and this uncertainty limits the usefulness of wage trends as an indicator of the Fed's progress in achieving its inflation objective." By the end of this week, the US will release its Nonfarm Payroll figures, with market lately focusing more in wages that employment creation, but these comments will hardly convince investors if we had another round of weak salaries.
In another order of news, Greece finally submitted late Friday a list of reforms that include combat tax evasion, higher taxes on alcohol and cigarettes, and a controversial series of privatizations, aiming to raise €3bn and therefore unlock €7.2bn in bail-out cash from its creditors. These last are still to approve the measures and come out with an answer this week. Despite US data has been quite soft lately, the medium term outlook remains bullish for the USD, although latest choppy price action suggests investors are still uncertain on whether the latest bearish corrective movement is already complete. As for the EUR, the ongoing ECB's QE and Greek jitters, should keep the upside limited and favor selling into rallies.
Technically, the 4 hours chart shows that the price ended last week a few pips above 1.0865, the 38.2% retracement of the bearish move between 1.1533 and 1.0461 although below its 20 SMA, and with the technical indicators maintaining bearish slopes below their mid-lines. The critical resistance level continues to be 1.0950, as the pair needs to extend beyond it to be able to retest the 1.1000 area, whilst Friday's low at 1.0800 is the intraday line in the sand to the downside.
Support levels: 10865 1.0830 1.0800
Resistance levels: 1.0910 1.0950 1.1000
EUR/JPY Current price: 129.65
View Live Chart for the EUR/JPY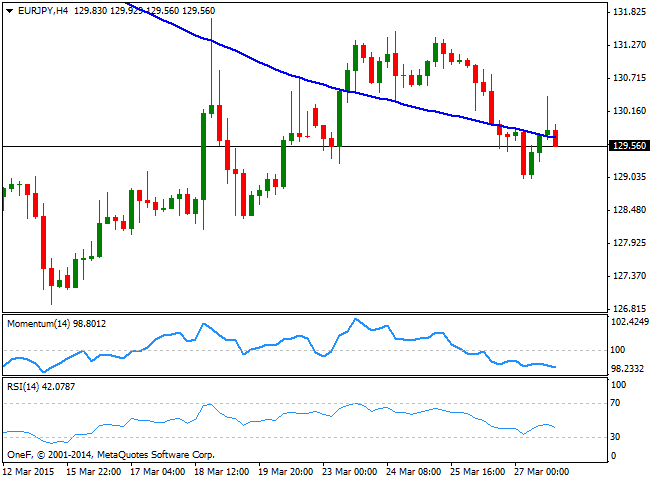
The Japanese yen saw some limited demand on its safe-haven condition, triggered by the political tension in the Middle East, following news Arabia Saudi launched an air strike over rebels in Yemen. The EUR/JPY surged up to 131.50 last week, but closed below the 130.0 level maintaining a bearish bias according to the 4 hours chart that shows that the price is struggling around a bearish 100 SMA, whilst the technical indicators head lower below their mid-lines, supporting additional declines. In the 1 hour chart, the price stands below both, the 100 and 200 SMAs, whilst the indicators present a mild negative tone, supporting the longer term view. As long as below 130.00, the upside will remain limited with a break above 130.40 required to revert the dominant bearish trend.
Support levels: 129.30 128.80 128.40
Resistance levels: 129.90 130.35 130.80
GBP/USD Current price: 1.4889
View Live Chart for the GBP/USD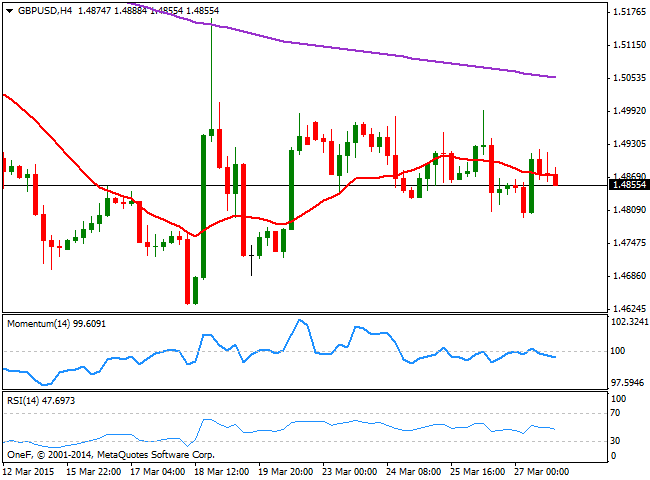
The British Pound has been the worst performer against the greenback last week, with the pair unable to advance beyond the 1.5000 figure. The GBP/USD was the only pair among majors that failed to advance beyond the post-FOMC high, and in fact held over 160 pips below it. The latest inflation figures in the UK, showing 0.00% growth yearly basis, have kept the GBP weak, trading within 1.4800 and 1.5000 for most of last week. The short term technical picture is neutral-to-bearish, as the 1 hour chart shows that the price ended the week below a flat 20 SMA, whilst the technical indicators head lower around their mid-lines. In the 4 hours chart the price aims lower below a bearish 20 SMA, around 1.4880 offering immediate intraday resistance, whilst the Momentum indicator failed to stay above the 100 level and now gains bearish strength below it, and the RSI maintains its bearish slope around 47, supporting additional declines on a break below 1.4830, the immediate support.
Support levels: 1.4830 1.4790 1.4750
Resistance levels: 1.4880 1.4920 1.4950
USD/JPY Current price: 119.09
View Live Chart for the USD/JPY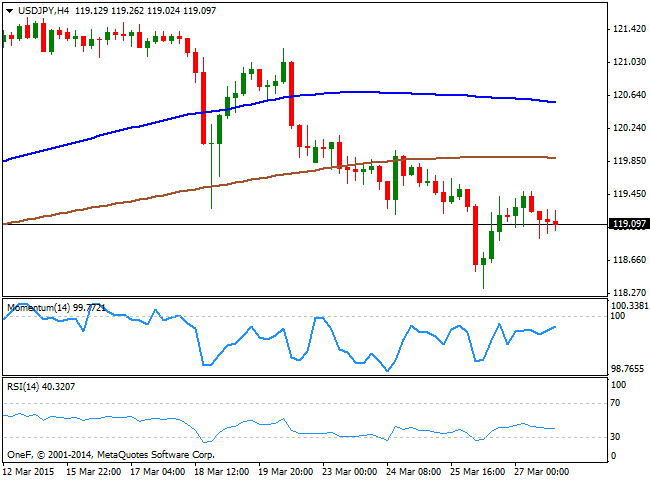
The USD/JPY pair trades around the 119.00 figure, struggling around its 100 DMA for the first time since August last year. The pair seems to have found an interim top at 122.02, the multi-year high posted early March, as further downside below the 100 DMA, should signal a downward continuation for this week. Technically, the 1 hour chart shows that the price is being capped by a bearish 100 SMA, currently around 119.40, whilst the technical indicators present a mild bearish tone below their mid-lines. In the 4 hours chart, the pair develops below its 100 and 20 SMAs, whilst the technical indicators stand directionless below their mid-lines, showing no directional strength at the time being. A break below 118.70 support should lead to an extension down to 118.30, last week low, with a break below it confirming the longer term view and anticipating a downward extension towards the 116.60 price zone.
Support levels: 118.70 118.30 117.80
Resistance levels: 119.40 119865 120.20
AUD/USD Current price: 0.7743
View Live Chart for the AUD/USD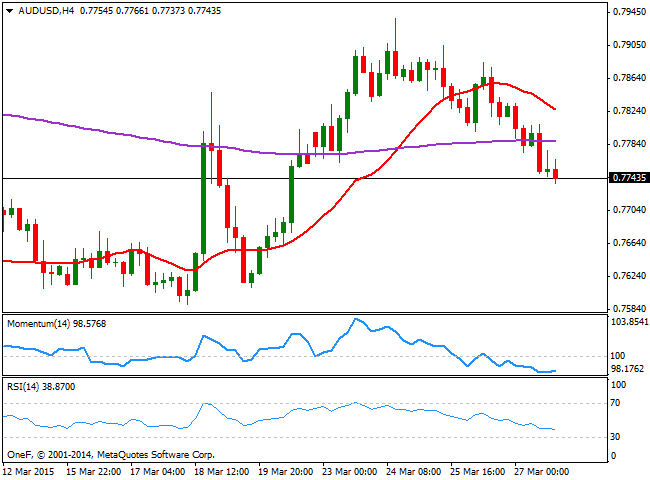
The AUD/USD pair retraced further from the 8-week high posted at 0.7937, closing near 0.7737, the weekly low posted late Friday. The Aussie found some limited support in gold prices' recovery, albeit finally capitulated to speculation the RBA may cut its main rate at the April 7th meeting. The AUD/USD pair may continue its way south this week, particularly if the 0.7710 level, the 20 SMA in the daily chart gives up. Technically and in the short term, the 1 hour chart shows that the price extended below a strongly bearish 20 SMA, whilst the Momentum indicator aims lower below 100 and the RSI also heads south, near 30. In the 4 hours chart the price is now below a strongly bearish 20 SMA and the 200 EMA, this last around 0.7790 and providing a strong dynamic resistance, whist the technical indicators have lost their bearish strength, but remain well below their mid-lines, supporting the general bearish tone.
Support levels: 0.7710 0.7660 0.7625
Resistance levels: 0.7790 0.7840 0.7885
Recommended Content
Editors’ Picks
EUR/USD holds below 1.0750 ahead of key US data

EUR/USD trades in a tight range below 1.0750 in the European session on Friday. The US Dollar struggles to gather strength ahead of key PCE Price Index data, the Fed's preferred gauge of inflation, and helps the pair hold its ground.
GBP/USD consolidates above 1.2500, eyes on US PCE data

GBP/USD fluctuates at around 1.2500 in the European session on Friday following the three-day rebound. The PCE inflation data for March will be watched closely by market participants later in the day.
Gold clings to modest daily gains at around $2,350

Gold stays in positive territory at around $2,350 after closing in positive territory on Thursday. The benchmark 10-year US Treasury bond yield edges lower ahead of US PCE Price Index data, allowing XAU/USD to stretch higher.
Bitcoin Weekly Forecast: BTC’s next breakout could propel it to $80,000 Premium

Bitcoin’s recent price consolidation could be nearing its end as technical indicators and on-chain metrics suggest a potential upward breakout. However, this move would not be straightforward and could punish impatient investors.
US core PCE inflation set to signal firm price pressures as markets delay Federal Reserve rate cut bets

The core PCE Price Index, which excludes volatile food and energy prices, is seen as the more influential measure of inflation in terms of Fed positioning. The index is forecast to rise 0.3% on a monthly basis in March, matching February’s increase.