EUR/USD Current price: 1.2496
View Live Chart for the EUR/USD
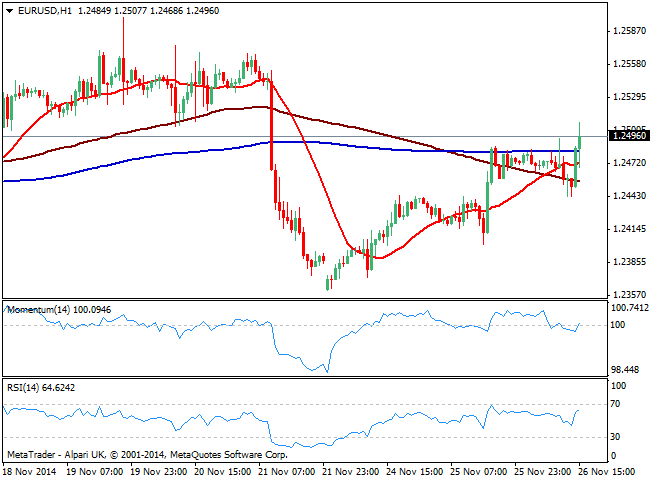
The EUR/USD pair battles to overcome the 1.2500 level, after the first batch of US data resulted disappointing: US Durable goods orders ex transp. fell 0.9% against an expected rise of 1.0%, jobless claims are up to 313K, while consumption data resulted mixed. The dollar shed ground across the board ahead of the next round of readings, with the EUR/USD 1 hour chart showing price extending above its moving averages, and indicators aiming higher in neutral territory, still not signaling further advances. In the 4 hours chart technical readings present a mild positive tone, yet price needs to extend beyond 1.2520 immediate resistance to confirm further intraday advances towards 1.2560 price zone.
Support levels: 1.2485 1.2440 1.2400
Resistance levels: 1.2520 1.2560 1.2600
GBP/USD Current price: 1.5780
View Live Chart for the GBP/USD
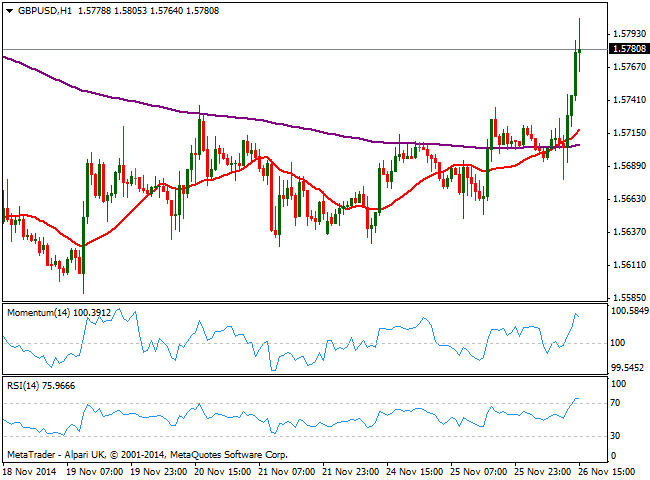
The GBP/USD flirted with the 1.5800 level finally breaking its recent range to the upside on tepid positive news coming from the UK. Despite not a surprise, GDP readings printed as expected a 3.0% growth, albeit business investment suffered a small setback. Technically, the 1 hour chart shows price extending above its 20 SMA while indicators enter overbought territory, mostly due to recent lack of direction than a suggesting a strong upward continuation, while in the 4 hours chart indicators also turned higher after price failed to break below its 20 SMA. If 1.5770 attracts buyers on pullbacks, the upside is favored towards 1.5825 price zone in the short term, and up to 1.5860/80 if the last gives up.
Support levels: 1.5770 1.5740 1.5700
Resistance levels: 1.5825 1.5860 1.5900
USD/JPY Current price: 117.71
View Live Chart for the USD/JPY
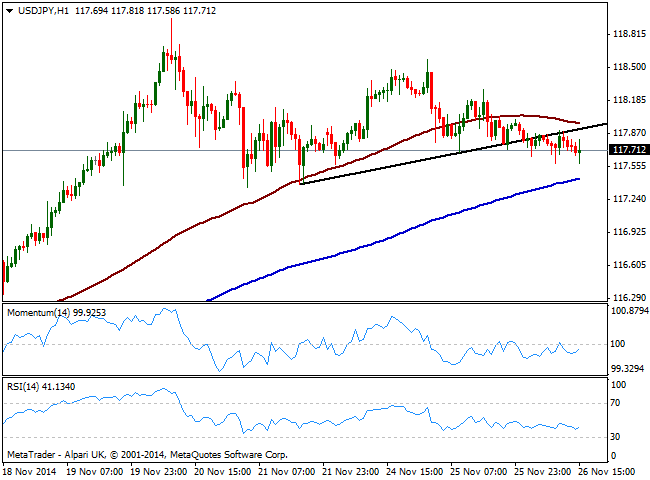
Trading lower in range, the USD/JPY has broke below a short term ascendant trend line, albeit holds above recent lows in the 117.30/40 price zone, immediate support. The 1 hour chart shows indicators lacking directional strength below their midlines, while 100 SMA gains a shy bearish slope above current price. In the 4 hours chart indicators rest around their midlines presenting a quite limited bearish slope, but for the most neutral. Price needs to accelerate below mentioned support area to extend its decline over the upcoming hours, while the short term bearish tone will prevail as long as 118.00 contains the upside.
Support levels: 117.35 117.00 116.65
Resistance levels: 118.00 118.40 118.90
AUD/USD Current price: 0.8508
View Live Chart of the AUD/USD
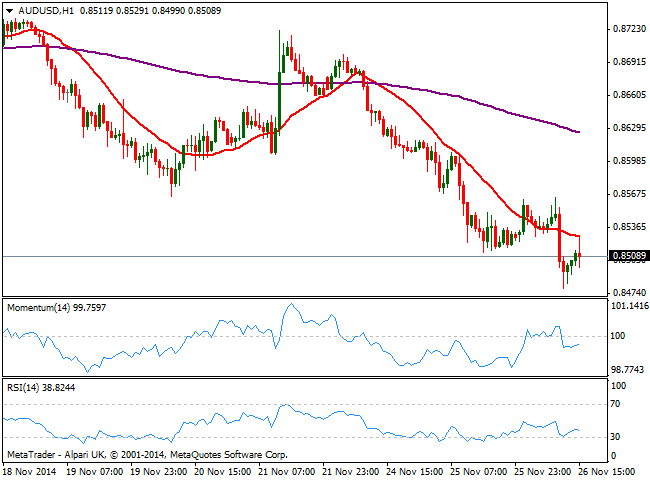
Australian dollar sees no relief, having felt against the greenback down to 0.8479 levels not seen since July 2010. The AUD/USD 1 hour chart shows weak US data triggered a short term spike higher that was contained by a bearish 20 SMA around 0.8530, while indicators head lower in negative territory. In the 4 hours chart indicators stand in extreme oversold levels, as price consolidates near mentioned low. If US data continues to disappoint, a short covering rally may see the pair recovering some ground up to 0.8570 price zone, but the dominant trend is still bearish, and sellers will like resurge on temporal advances.
Support levels: 0.8470 0.8425 0.8380
Resistance levels: 0.8530 0.8570 0.8610
Recommended Content
Editors’ Picks
EUR/USD holds below 1.0750 ahead of key US data

EUR/USD trades in a tight range below 1.0750 in the European session on Friday. The US Dollar struggles to gather strength ahead of key PCE Price Index data, the Fed's preferred gauge of inflation, and helps the pair hold its ground.
GBP/USD consolidates above 1.2500, eyes on US PCE data

GBP/USD fluctuates at around 1.2500 in the European session on Friday following the three-day rebound. The PCE inflation data for March will be watched closely by market participants later in the day.
Gold clings to modest daily gains at around $2,350

Gold stays in positive territory at around $2,350 after closing in positive territory on Thursday. The benchmark 10-year US Treasury bond yield edges lower ahead of US PCE Price Index data, allowing XAU/USD to stretch higher.
Bitcoin Weekly Forecast: BTC’s next breakout could propel it to $80,000 Premium

Bitcoin’s recent price consolidation could be nearing its end as technical indicators and on-chain metrics suggest a potential upward breakout. However, this move would not be straightforward and could punish impatient investors.
US core PCE inflation set to signal firm price pressures as markets delay Federal Reserve rate cut bets

The core PCE Price Index, which excludes volatile food and energy prices, is seen as the more influential measure of inflation in terms of Fed positioning. The index is forecast to rise 0.3% on a monthly basis in March, matching February’s increase.