EUR/USD Current Price: 1.1319
View Live Chart for the EUR/USD
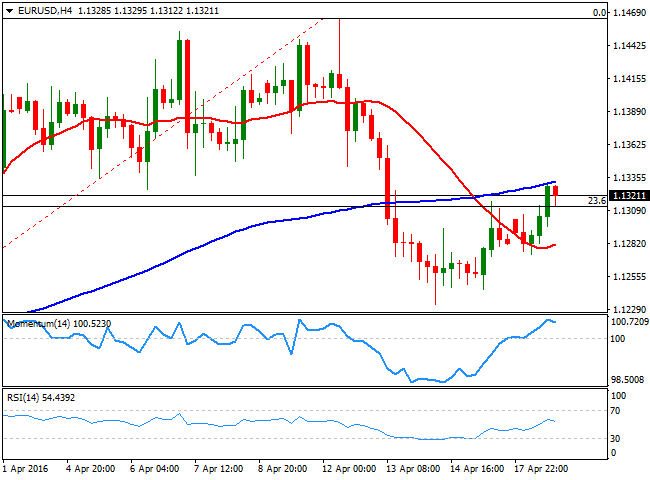
Risk aversion led the way at the beginning of the week, after oil producers failed to reach an agreement in the Qatar meeting. Surprisingly, the common currency was unable to run as usual lately on safe-haven demand, holding below the 1.1330 region, the base of the range that contained price for much of the last two weeks. The macroeconomic calendar was quite light all through the day, with only a couple of FED´s speakers hitting the wires that anyway did not add anything new. Things could get a bit more interesting on Tuesday, as Europe will release its latest current account, alongside with the German ZEW survey, while the US will publish some housing data.
As for the EUR/USD technical outlook, there is little to work with at the time being, as, despite the dollar is broadly lower, the pair remains below the critical short term resistance mentioned before. In the 4 hours chart, however, the price has managed to recover above its 20 SMA, flat around 1.1270, although it was unable to detach from the 23.6% retracement of the latest daily bullish run. The technical indicators in the mentioned time frame, have crossed above their mid-lines, but lost upward strength. The lack of momentum suggests that EUR bulls are taking a step aside ahead of the ECB meeting this Thursday, and that the pair may remain range bound during the upcoming hours, between 1.1220, the 38.2% retracement of the mentioned rally and .1380.
Support levels: 1.1270 1.1235 1.1200
Resistance levels: 1.1335 1.1380 1.1420
EUR/JPY Current price: 123.18
View Live Chart for the EUR/JPY
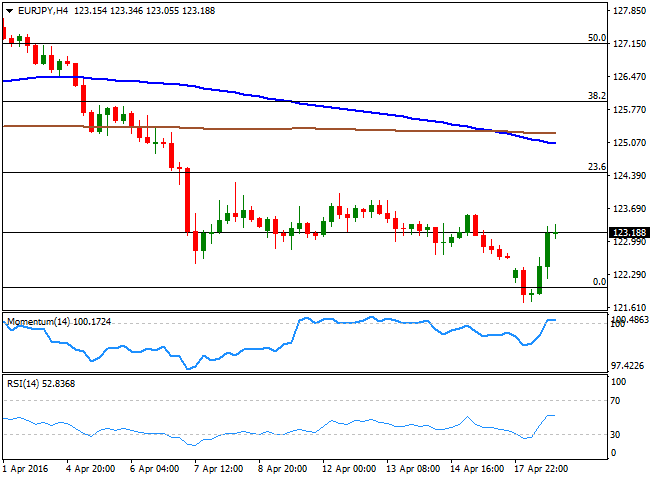
The Japanese yen gapped higher against most of its major rivals at the weekly opening, leading to a decline in the EUR/JPY to 121.70, its lowest in two-years. The pair however, bounced in the American afternoon, as Wall Street managed to hold in the green, whilst BOJ's Governor Kuroda reiterated that the Central Bank is ready to ease further. The intraday recovery in the pair stalled below Friday's high of 123.53, and the 1 hour chart shows that the technical indicators have lost upward strength near overbought territory, and are currently turning south, whilst the price is trapped between the 100 and 200 SMAs, this last offering an immediate resistance around 123.40. In the 4 hours chart, the technical indicators bounced from oversold readings, but turned flat after reaching their mid-lines, maintaining a neutral stance at the time being, whilst the price remains well below its moving averages, leaving little room for additional gains.
Support levels: 122.50 122.00 121.60
Resistance levels: 123.35 123.60 124.00
GBP/USD Current price: 1.4278
View Live Chart for the GBP/USD
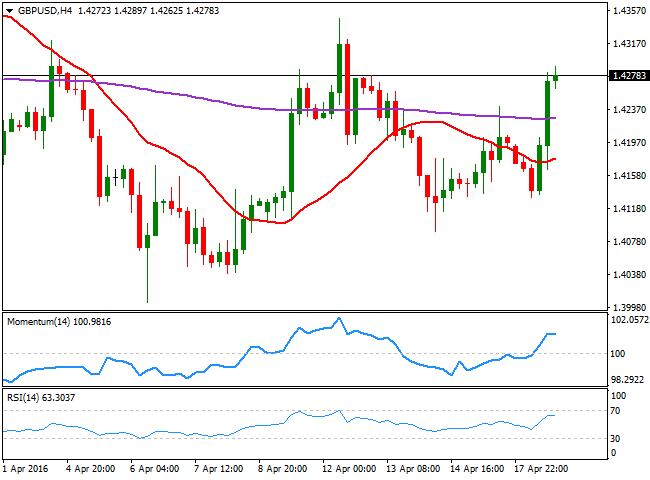
The British Pound advanced sharply during US trading hours, resulting the GBP/USD pair advancing up to 1.4289, where it stands by the end of the US session. The pair started the day with a soft tone, falling down to 1.4130 as oil and stocks plummeted, but as risk sentiment improved, so did the pair. There were no macroeconomic releases in the UK, but Treasury chief George Osborne was on the wires, with the latest government assessments on how a Brexit can damage the UK economy. Nevertheless, the pair got a boost from GBP/JPY demand, as the pair added over 340 pips once the JPY lost its upward strength. Still capped below 1.4300, the GBP/USD retains a short term positive tone, as in the 1 hour chart, the price accelerated strongly after crossing above its 20 SMA, although the technical indicators have turned horizontal within overbought territory. In the 4 hours chart, the price has advanced beyond its 20 SMA and its 20 EMA, although both remain flat and with no certain directional strength, whilst the technical indicators have stalled their advances well above their mid-lines, rather reflecting the latest consolidative stage than suggesting the bullish run is exhausted.
Support levels: 1.4240 1.4200 1.4160
Resistance levels: 1.4330 1.4375 1.4410
USD/JPY Current price: 108.84
View Live Chart for the USD/JPY
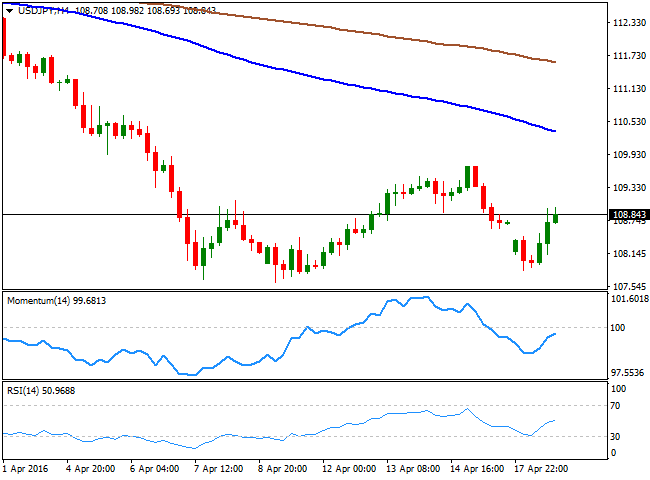
The American dollar trimmed losses against its Japanese rival after BOJ's Governor Kuroda reiterated that the Central Bank is ready to ease further if needed. Also, and despite the early risk aversion, US stocks surged on strong earnings reports, leading to an advance in the USD/JPY that anyway stalled around Friday's close. The pair flirted with the 109.00, but retreated from its 100 SMA in the 1 hour chart, whilst the technical indicators in the mentioned time frame have turned flat near overbought levels, indicating some short term upward exhaustion ahead of the Asian opening. In the 4 hours chart, the technical indicators bounced from oversold levels, but the Momentum indicator remains below its 100 level, whilst the RSI indicator has lost upward strength around 51, suggesting further gains are yet to be confirmed. The dominant bearish trend is still in place, as only some follow through above the 110.00 figure will favor a stepper recovery, quite unlikely considering the poor demand surrounding the USD.
Support levels: 108.45 107.95 107.60
Resistance levels: 109.10 109.50 110.00
AUD/USD Current price: 0.7745
View Live Chart for the AUD/USD
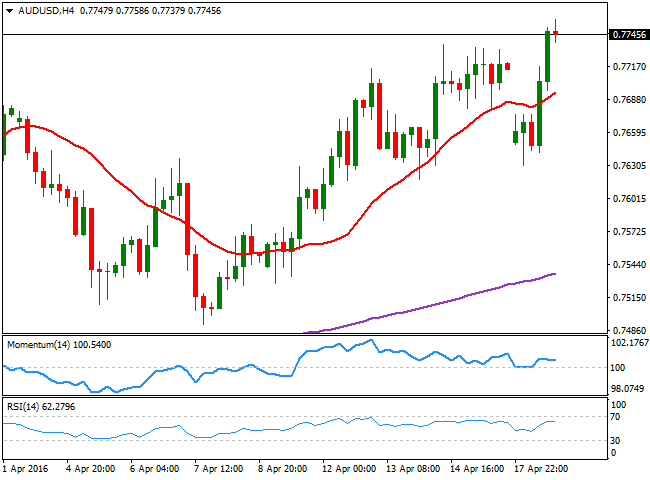
The Australian dollar advanced to a fresh 10-month high against the greenback of 0.7751, after trading as low as 0.7630 at the beginning of the day. The recovery occurred in US trading hours, as Wall Street traded in the green, despite the previous risk-averse environment, whilst oil prices recovered most of its early losses. The RBA will release the Minutes of its latest meeting during the upcoming session that anyway should not come as a surprise, as Governor Stevens usually anticipates most of them in its speech following the economic decision. Nevertheless, and considering the Aussie's strength, comments on concerns over how this may affect the local growth may see the pair retreating temporally. The AUD/USD technical picture is bullish, with investors still willing to buy on intraday dips. Short term, the upward potential is limited, as in the 1 hour chart the technical indicators are retreating from overbought levels, but in the 4 hours chart, the price has accelerated above a bullish 20 SMA, whilst the technical indicators consolidate within positive territory, leaving doors open for a continued advance towards 0.7800 and beyond for this Tuesday.
Support levels: 0.7730 0.7690 0.7650
Resistance levels: 0.7760 0.7800 0.7845
Information on these pages contains forward-looking statements that involve risks and uncertainties. Markets and instruments profiled on this page are for informational purposes only and should not in any way come across as a recommendation to buy or sell in these assets. You should do your own thorough research before making any investment decisions. FXStreet does not in any way guarantee that this information is free from mistakes, errors, or material misstatements. It also does not guarantee that this information is of a timely nature. Investing in Open Markets involves a great deal of risk, including the loss of all or a portion of your investment, as well as emotional distress. All risks, losses and costs associated with investing, including total loss of principal, are your responsibility. The views and opinions expressed in this article are those of the authors and do not necessarily reflect the official policy or position of FXStreet nor its advertisers. The author will not be held responsible for information that is found at the end of links posted on this page.
If not otherwise explicitly mentioned in the body of the article, at the time of writing, the author has no position in any stock mentioned in this article and no business relationship with any company mentioned. The author has not received compensation for writing this article, other than from FXStreet.
FXStreet and the author do not provide personalized recommendations. The author makes no representations as to the accuracy, completeness, or suitability of this information. FXStreet and the author will not be liable for any errors, omissions or any losses, injuries or damages arising from this information and its display or use. Errors and omissions excepted.
The author and FXStreet are not registered investment advisors and nothing in this article is intended to be investment advice.
Recommended Content
Editors’ Picks
EUR/USD edges lower toward 1.0700 post-US PCE

EUR/USD stays under modest bearish pressure but manages to hold above 1.0700 in the American session on Friday. The US Dollar (USD) gathers strength against its rivals after the stronger-than-forecast PCE inflation data, not allowing the pair to gain traction.
GBP/USD retreats to 1.2500 on renewed USD strength

GBP/USD lost its traction and turned negative on the day near 1.2500. Following the stronger-than-expected PCE inflation readings from the US, the USD stays resilient and makes it difficult for the pair to gather recovery momentum.
Gold struggles to hold above $2,350 following US inflation

Gold turned south and declined toward $2,340, erasing a large portion of its daily gains, as the USD benefited from PCE inflation data. The benchmark 10-year US yield, however, stays in negative territory and helps XAU/USD limit its losses.
Bitcoin Weekly Forecast: BTC’s next breakout could propel it to $80,000 Premium

Bitcoin’s recent price consolidation could be nearing its end as technical indicators and on-chain metrics suggest a potential upward breakout. However, this move would not be straightforward and could punish impatient investors.
Week ahead – Hawkish risk as Fed and NFP on tap, Eurozone data eyed too

Fed meets on Wednesday as US inflation stays elevated. Will Friday’s jobs report bring relief or more angst for the markets? Eurozone flash GDP and CPI numbers in focus for the Euro.