EUR/USD Current Price: 1.1316
View Live Chart for the EUR/USD
It was another bad day for dollar's bulls, as the negative momentum of the American currency extended all through the board, sending most of its counterparts to fresh multi-month highs. The EUR/USD pair extended its gains up to 1.1341, its highest in over a month, helped by some positive local data, as the EU inflation surged 0.2% in February, beating estimates and back in positive ground, although the year-on-year figure showed a 0.2% slide as expected. Also in Europe, the international trade in goods posted a surplus of €6.2B, as imports fell by 1% and exports decreased 2% during the same month.
In the US, the current account deficit narrowed from an upwardly-revised reading in Q3, down to $125.3B, while weekly unemployment claims resulted at 265K for the week ending March 11th, beating expectations of 268K. The Philadelphia FED Manufacturing survey was also pretty encouraging, up to 12.4 from previous -2.8. Nevertheless, the extremely cautious tone of Yellen last Wednesday maintained the dollar in sell-off mode for a second day in-a-row.
The EUR/USD pair fell down to 1.1277 during the American afternoon, but quickly regained the 1.1300 level, indicating investors are willing to buy on dips. The technical picture continues favoring the upside, as in the 4 hours chart, the technical indicators keep heading higher, despite being in overbought territory. Friday may bring some profit taking, but with the Central Banks done for this month, the pullback will likely be limited. Should the rally extend beyond 1.1375, February high, the pair has scope to test the 1.1460 region, the level that capped the upside for most of the last 2015.
Support levels: 1.1290 1.1245 1.1200
Resistance levels: 1.1340 1.1375 1.1410
EUR/JPY Current price: 126.02
View Live Chart for the EUR/JPY
The Japanese yen saw some wild action this Thursday, as the currency appreciated during the London session, tracking sharp losses in local share markets, later reversed. The EUR/JPY plunged to a daily low of 125.31, when rumors on the BOJ "checking prices" sent the pair up to of 126.48. Things got quieter in the American afternoon, with the pair being driven higher by EUR demand. Technically, the 1 hour chart shows that the pair has been pretty much consolidating between its 100 and 200 SMAs, with the shortest offering an immediate resistance at 126.15. In the same chart, the technical indicators hover around their mid-lines, diverging from each other and therefore unable to offer clear directional clues. In the 4 hours chart, a slightly positive tone prevails, as the technical indicators present limited bullish slopes above their mid-lines, although the price remains below a mild bearish 200 SMA, in where selling interest has been containing rallies for the past two weeks.
Support levels: 125.80 125.40 125.00
Resistance levels: 126.15 126.50 126.90
GBP/USD Current price: 1.4473
View Live Chart for the GBP/USD
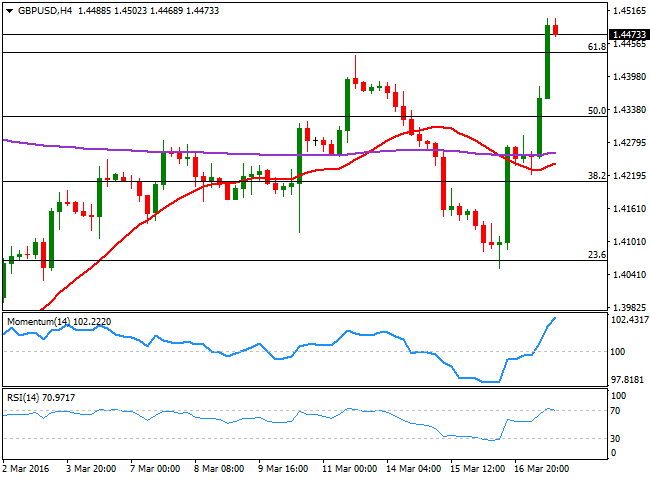
The British Pound skyrocketed, outperforming its major rivals, and reaching 1.4502 against the greenback, the highest since February 16th. The BOE announced its latest economic policy decisions this Wednesday, will all nine members voting to keep rates unchanged at 0.5%, and the Assets Purchase Program at £375 billion. The BOE also warned that the uncertainty surrounding a Brexit, represents a downward risk for the economy in the months ahead of the vote, and will likely weigh on Sterling. The GBP/USD retreated after these comments, but only to jump higher on broad dollar weakness. Currently trading above the 61.8% retracement of this year's decline, the short term picture is bullish for the pair, as the technical indicators have resumed their advances well into overbought territory, after a limited downward correction, whilst the 20 SMA heads sharply higher below the current level. In the 4 hours chart, the Momentum indicator keeps heading north within overbought territory, but the RSI indicator has lost its upward strength, rather suggesting some consolidation ahead than supporting a downward move.
Support levels: 1.4445 1.4410 1.4370
Resistance levels: 1.4510 1.4550 1.4590
USD/JPY Current price: 111.40
View Live Chart for the USD/JPY
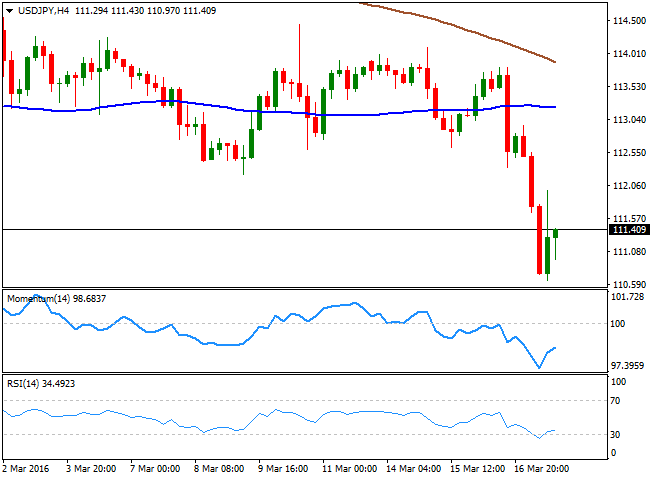
The USD/JPY pair fell to its lowest in a year and a half this Thursday, pricing 110.66 before some market talks about a possible BOJ intervention sent it up to test the 112.00 level. The Japanese yen gained ever since the day started, in spite the country reported a smaller-than-expected trade surplus in February of ¥242.8B although still showing improvement, compared to January. The drop in US yields and the weakening greenback were behind the decline, fueled by the strong negative opening in European equities. After the dust settled, the pair resumed its slide, now hovering around 111.40, and with the 1 hour chart showing that the 100 and 200 SMAs have accelerated their declines far above the current level, while the technical indicators have bounced from overbought levels, but remain within negative territory, rather following the latest upward corrective move than suggesting the pair may advance further. In the 4 hours chart, the technical indicators also corrected oversold readings, but have lost upward strength well below their mid-lines, in line with the shorter term outlook. The risk remains towards the downside, with another slide below 111.00 opening doors for a continued decline towards the 110.00 psychological support.
Support levels: 111.00 110.65 110.20
Resistance levels: 111.65 112.00 112.35
AUD/USD Current price: 0.7652
View Live Chart for the AUD/USD
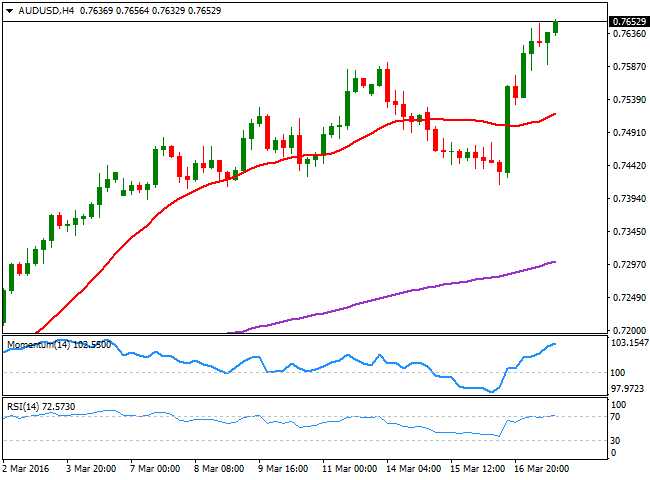
Commodity-related currencies lead the way higher against the greenback, buoyed by the rally in crude oil. At the beginning of the day, Australia released its employment data for February, in a mixed report that showed that the unemployment rate decline to 5.8% from previous 6.0% due to a slide in the participation rate, while the economy added just 300 new jobs in the month. The negative news sent the AUD/USD pair temporarily lowed, but broad dollar weakness prevailed, and it's now trading at its highest since July 2015 around 0.7650. Beyond the latest FED decision, Australia has been among the best performing economies during this first quarter of 2016, underpinning Aussie's gains. Now poised to extend its advance, the 1 hour chart shows that the price has bounced sharply higher after testing a bullish 20 SMA, currently at 0.7615, while the Momentum indicator is ready to resume its advance and the RSI indicator consolidates around 70. In the 4 hours chart, the bias is higher, as the technical indicators keep heading north, despite being in overbought territory, supporting a steady advance up to 0.7820 a major long term resistance.
Support levels: 0.7615 0.7580 0.7550
Resistance levels: 0.7690 0.7730 0.7775
Information on these pages contains forward-looking statements that involve risks and uncertainties. Markets and instruments profiled on this page are for informational purposes only and should not in any way come across as a recommendation to buy or sell in these assets. You should do your own thorough research before making any investment decisions. FXStreet does not in any way guarantee that this information is free from mistakes, errors, or material misstatements. It also does not guarantee that this information is of a timely nature. Investing in Open Markets involves a great deal of risk, including the loss of all or a portion of your investment, as well as emotional distress. All risks, losses and costs associated with investing, including total loss of principal, are your responsibility. The views and opinions expressed in this article are those of the authors and do not necessarily reflect the official policy or position of FXStreet nor its advertisers. The author will not be held responsible for information that is found at the end of links posted on this page.
If not otherwise explicitly mentioned in the body of the article, at the time of writing, the author has no position in any stock mentioned in this article and no business relationship with any company mentioned. The author has not received compensation for writing this article, other than from FXStreet.
FXStreet and the author do not provide personalized recommendations. The author makes no representations as to the accuracy, completeness, or suitability of this information. FXStreet and the author will not be liable for any errors, omissions or any losses, injuries or damages arising from this information and its display or use. Errors and omissions excepted.
The author and FXStreet are not registered investment advisors and nothing in this article is intended to be investment advice.
Recommended Content
Editors’ Picks

EUR/USD consolidates weekly gains above 1.1150
EUR/USD moves up and down in a narrow channel slightly above 1.1150 on Friday. In the absence of high-tier macroeconomic data releases, comments from central bank officials and the risk mood could drive the pair's action heading into the weekend.

GBP/USD stabilizes near 1.3300, looks to post strong weekly gains
GBP/USD trades modestly higher on the day near 1.3300, supported by the upbeat UK Retail Sales data for August. The pair remains on track to end the week, which featured Fed and BoE policy decisions, with strong gains.

Gold extends rally to new record-high above $2,610
Gold (XAU/USD) preserves its bullish momentum and trades at a new all-time high above $2,610 on Friday. Heightened expectations that global central banks will follow the Fed in easing policy and slashing rates lift XAU/USD.

Week ahead – SNB to cut again, RBA to stand pat, PCE inflation also on tap
SNB is expected to ease for third time; might cut by 50bps. RBA to hold rates but could turn less hawkish as CPI falls. After inaugural Fed cut, attention turns to PCE inflation.

Bank of Japan set to keep rates on hold after July’s hike shocked markets
The Bank of Japan is expected to keep its short-term interest rate target between 0.15% and 0.25% on Friday, following the conclusion of its two-day monetary policy review. The decision is set to be announced during the early Asian session.

Moneta Markets review 2024: All you need to know
VERIFIED In this review, the FXStreet team provides an independent and thorough analysis based on direct testing and real experiences with Moneta Markets – an excellent broker for novice to intermediate forex traders who want to broaden their knowledge base.


