EUR/USD Current Price: 1.0862
View Live Chart for the EUR/USD
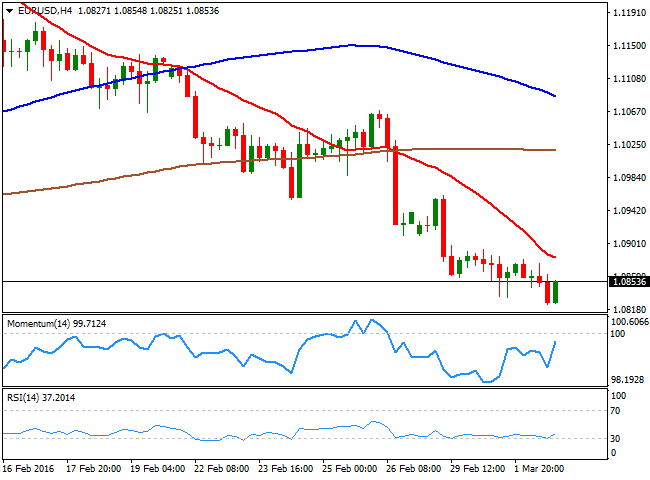
The dollar traded generally higher during the first half of the day, and even got a boost from the ADP employment survey, showing that the private sector added 214K new jobs during February and confirming continued strength in the jobs market. But the limited momentum of the American currency faded after Wall Street kicked in, with the currency poised to end the day on the red against all of its major rivals, but the EUR. The common currency continues to be pressured by speculation the ECB will add some sort of easing measure during the upcoming meeting, and ends this Wednesday with a lower low, and a lower high, for third day in-a-row.
During the Asian session, Moody's rating agency cited rising government debt, falling foreign currency reserves, and uncertainty about the reform agenda, to cut China's credit rating outlook from stable to negative, although stocks edged higher both in Asia and Europe. US ones however, had struggled around the opening all day long, unable to extend their latest rally, even despite the FED's Beige Book shows that the economic activity has expanded in most districts.
As for the technical picture, the intraday advance was not enough to reverse the dominant bearish trend, albeit the price has bounced after approaching the key support area at 1.0800/10. The 1 hour chart shows that the price continues developing below its 20 SMA, while the technical indicators have turned flat below their mid-lines after bouncing from oversold levels, reflecting the absence of buying interest. In the 4 hours chart, the technical indicators have also bounced from oversold readings, but remain well below their mid-lines, while the 20 SMA caps the upside in the 1.0880/90 region, where the pair also presents multiple intraday highs from earlier this week, and the level to break to see the bearish pressure easing.
Support levels: 1.0810 1.0770 1.0730
Resistance levels: 1.0890 1.0925 1.0960
EUR/JPY Current price: 123.29
View Live Chart for the EUR/JPY
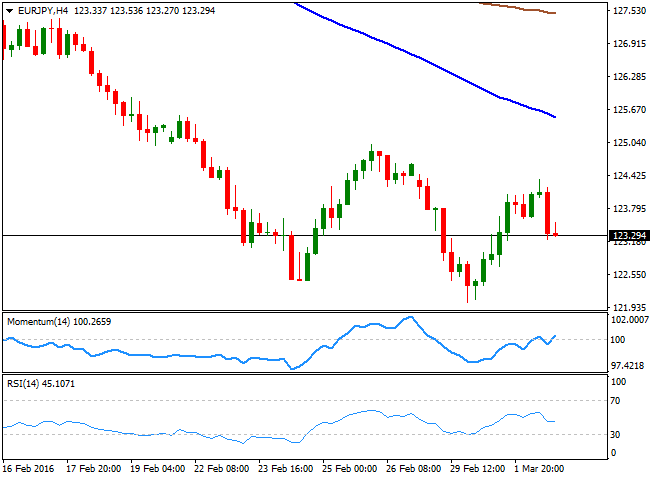
The EUR/JPY resumed its decline over the last trading sessions, and trades near its daily low, set at 123.19. The Japanese yen edged higher against all of it majors' rivals, as the dominant bullish trend in the currency prevailed, whilst safe-havens assets are back on demand. The pair earlier advanced up to 124.35 before retreating, and the technical picture shows that it´s poised to extend its decline, given that in the 1 hour chart, the pair is back below its 100 and 200 SMA, with the shortest providing an immediate resistance around 123.65, while the technical indicators have accelerated their declines within negative territory, having falter on an early advance around their mid-lines. In the 4 hours chart, the technical indicators diverge from each other in neutral territory, but the 100 SMA has extended its decline well above the current level whilst widening the distance with the 200 SMA, in line with the ongoing bearish movement.
Support levels: 122.90 122.50 122.10
Resistance levels: 123.65 124.10 124.55
GBP/USD Current price: 1.4011
View Live Chart for the GBP/USD
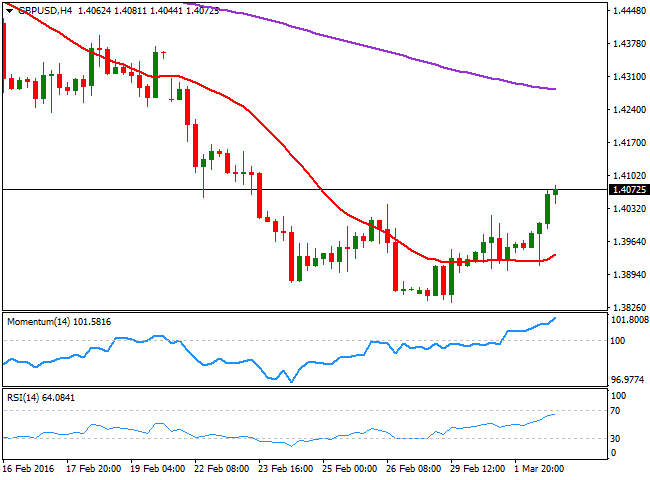
The GBP/USD pair trades at a fresh 6-day high, with the pair rising ever since the day started, as Brexit fears eased somehow during these last few days. The Sterling suffered a knee-jerk mid London session, following the release of the UK construction PMI that decline in February, losing nearly a point and landing at 54.2, a fresh 10-month low. But the pair later recovered, beginning to correct the overextended decline, and now poised to extend its advance according to technical readings. The pair can move back above the 1.41 level, and even extend up to the 1.4250 region, a line in the sand for the latest bearish trend, as if the price manages to extend beyond this last, the upside will look far more constructive. The short term outlook is bullish by the end of the day, as in the 1 hour chart, the Momentum and the RSI indicators have lost upward strength but hold within overbought territory, with no signs of turning lower, whilst the 20 SMA has advanced strongly below the current level, offering a strong dynamic support at 1.3990. In the 4 hours chart, the technical readings are also supportive of an upward continuation, as the Momentum indicator heads higher well above its 100 level, while the RSI indicator consolidates around 63. Should the pair hold above 1.4040, February 26th daily high, the downside will remain well limited, with scope to rally up to the mentioned 1.4250 price zone.
Support levels: 1.4040 1.3990 1.3950
Resistance levels: 1.4090 1.4130 1.4185
USD/JPY Current price: 113.58
View Live Chart for the USD/JPY
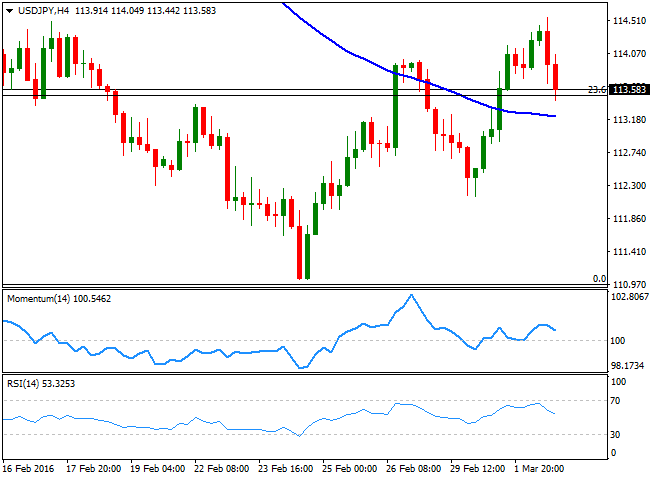
The USD/JPY pair spiked up to a fresh 2-week high of 114.55 this Wednesday, boosted by a better-than-expected US ADP employment survey, but the pair quickly changed course as US equities fell. Stocks later bounce, but the pair remained near its daily low, unable to attract buyers. Mid American afternoon, FED's Williams hit the wires saying that any changes in the interest-rate path may be modest and that the Central Bank maintains its latest stance, but the market is betting that a rate hike is now out of the table for this 2016, and it will take more than one strong employment report, to revert such idea. In the meantime, the market maintains its sell-the-spikes stance, with the daily high stalling short of the key resistance at 115.05, the 38.2% retracement of its latest daily slump. Short term, the bearish pressure continues to increase, given that the technical indicators have accelerated their declines and reached fresh lows within bearish territory, although the price is still above a bullish 100 SMA, currently around 113.25, the immediate support. In the 4 hours chart, the technical indicators have also turned south, but remain above their mid-lines, suggesting a downward extension below the mentioned 113.25 support is required to confirm a stronger bearish move.
Support levels: 113.25 112.80 112.40
Resistance levels: 113.70 114.10 114.60
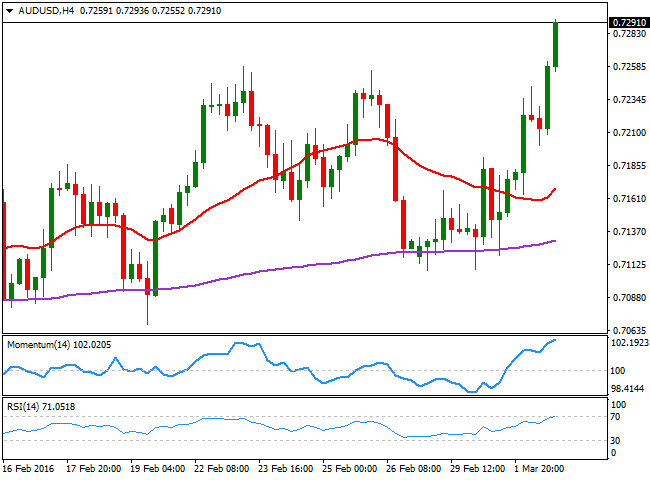
AUD/USD Current price: 0.7292
View Live Chart for the AUD/USD
The Australian dollar soared, to flirt with the 0.7300 level against the greenback, finding support earlier in the day on a much stronger-than-expected Q4 GDP reading. According to official data the economy expanded 3.0% in the last quarter of 2015, and compared to a year before, well above market's expectations of a 2.5% advance. The positive news may not be enough to spur the shadow of weak inflation and growth, but at least indicates the economy is far from slowing down, in spite of Chinese woes. The pair later retreated towards the 0.7200 level, where buying interest resumed, sending the pair back sharply higher, confirming the ongoing bullish trend. The 1 hour chart shows that the technical indicators are losing upward momentum within overbought territory, yet with the price holding on to its daily high and far above a sharply bullish 20 SMA, the upside remains favored. In the 4 hours chart, the technical indicators continue heading higher, also in overbought territory, while the price is now far above its moving averages, indicating some continued advance beyond 0.7300 for this Thursday.
Support levels: 0.7260 0.7225 0.7170
Resistance levels: 0.7300 0.7340 0.7395
Information on these pages contains forward-looking statements that involve risks and uncertainties. Markets and instruments profiled on this page are for informational purposes only and should not in any way come across as a recommendation to buy or sell in these assets. You should do your own thorough research before making any investment decisions. FXStreet does not in any way guarantee that this information is free from mistakes, errors, or material misstatements. It also does not guarantee that this information is of a timely nature. Investing in Open Markets involves a great deal of risk, including the loss of all or a portion of your investment, as well as emotional distress. All risks, losses and costs associated with investing, including total loss of principal, are your responsibility. The views and opinions expressed in this article are those of the authors and do not necessarily reflect the official policy or position of FXStreet nor its advertisers. The author will not be held responsible for information that is found at the end of links posted on this page.
If not otherwise explicitly mentioned in the body of the article, at the time of writing, the author has no position in any stock mentioned in this article and no business relationship with any company mentioned. The author has not received compensation for writing this article, other than from FXStreet.
FXStreet and the author do not provide personalized recommendations. The author makes no representations as to the accuracy, completeness, or suitability of this information. FXStreet and the author will not be liable for any errors, omissions or any losses, injuries or damages arising from this information and its display or use. Errors and omissions excepted.
The author and FXStreet are not registered investment advisors and nothing in this article is intended to be investment advice.
Recommended Content
Editors’ Picks
EUR/USD holds below 1.0750 ahead of key US data

EUR/USD trades in a tight range below 1.0750 in the European session on Friday. The US Dollar struggles to gather strength ahead of key PCE Price Index data, the Fed's preferred gauge of inflation, and helps the pair hold its ground.
GBP/USD consolidates above 1.2500, eyes on US PCE data

GBP/USD fluctuates at around 1.2500 in the European session on Friday following the three-day rebound. The PCE inflation data for March will be watched closely by market participants later in the day.
Gold clings to modest daily gains at around $2,350

Gold stays in positive territory at around $2,350 after closing in positive territory on Thursday. The benchmark 10-year US Treasury bond yield edges lower ahead of US PCE Price Index data, allowing XAU/USD to stretch higher.
Bitcoin Weekly Forecast: BTC’s next breakout could propel it to $80,000 Premium

Bitcoin’s recent price consolidation could be nearing its end as technical indicators and on-chain metrics suggest a potential upward breakout. However, this move would not be straightforward and could punish impatient investors.
US core PCE inflation set to signal firm price pressures as markets delay Federal Reserve rate cut bets

The core PCE Price Index, which excludes volatile food and energy prices, is seen as the more influential measure of inflation in terms of Fed positioning. The index is forecast to rise 0.3% on a monthly basis in March, matching February’s increase.
