EUR/USD Current price: 1.1172
View Live Chart for the EUR/USD
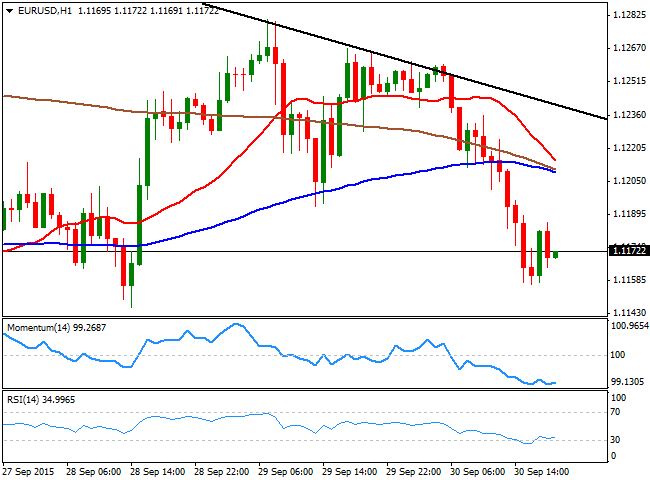
The EUR/USD pair closed the day near its daily low set at 1.1156 during the American session, as worldwide stocks recovered, driving the common currency lower against most of its rivals. Data coming from Europe was soft, as the EU inflation fell into negative territory in September, printing -0.1% from a year before, which triggered speculation the ECB may need to add additional QE. Unemployment in the region ticked up to 11.0% in September, whilst in Germany the latest data showed new 2,000 people out of job against expectations of a 5,000 decrease. In the US, the ADP survey showed that the private sector added 200K new jobs in September anticipating a positive NFP next Friday. The Chicago PMI however, plunged to 48.7 in the same month, from the previous 54.4, forcing the dollar to pare gains.
Trading near the base of the range, the 1 hour chart shows that the technical indicators are now consolidating near oversold levels, whilst the price extended well below its moving averages, with short term sellers surging in the 1.1180/90 price zone. In the 4 hours chart, the price has extended below the 20 SMA that anyway remains flat, whilst the Momentum indicator remains directionless around its 100 SMA and the RSI holds steady around 40, maintaining the risk towards the downside, albeit far from signaling additional declines at the time being.
Support levels: 1.1160 1.1120 1.1080
Resistance levels: 1.1190 1.1245 1.1290
EUR/JPY Current price: 133.88
View Live Chart for the EUR/JPY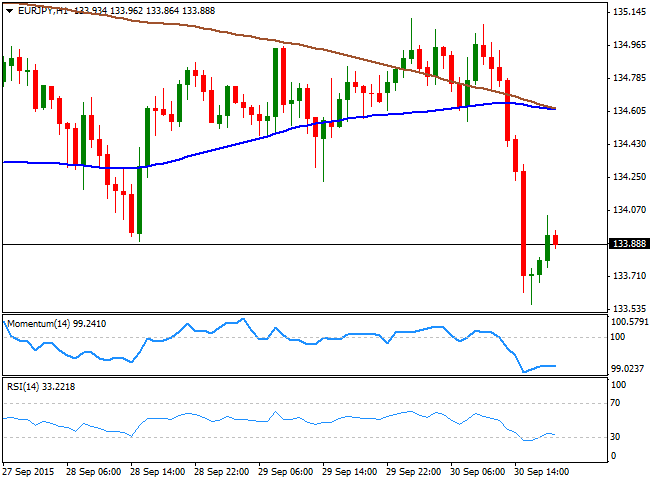
The Japanese yen appreciated sharply against all of its rivals ahead of the London fix, with no reason behind it, but demand surging at the quarter end. Worse-than-expected Chicago PMI in the US helped the JPY advance alongside with self EUR weakness, resulting in a decline down to 133.56 daily basis. The short term technical picture supports a continued decline, as the 1 hour chart shows that the price is well below its 100 and 200 SMAs, both converging around 134.60, whilst the technical indicators are turning slightly lower after a limited upward correction from oversold levels. In the 4 hours chart, the technical indicators lack directional strength below their mid-lines, whilst the price is hovering around the previous weekly low and far below its moving averages, in line with the shorter term view.
Support levels: 133.30 132.90 132.50
Resistance levels: 134.20 134.60 135.10
GBP/USD Current price: 1.5138
View Live Chart for the GPB/USD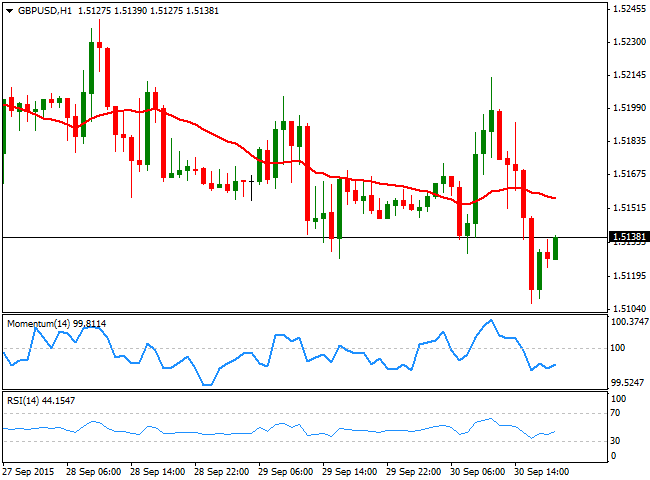 The British Pound edged lower for a tenth day in a row against its American rival, with the pair extending its decline to a fresh 4-month low of 1.5106. Earlier in the day, the UK released the latest review of its Q2 GDP, which came as expected at 0.7%. Yearly basis, growth reached 2.4%, missing expectations of 2.6%. A positive surprise came from the current account deficit that narrowed to £16.8B from a revised £24B in Q1. Following the release, the GBP/USD pair advanced up to its daily high of 1.5213, where once again, selling interest contained the advance. The downward movement seems overdone, but there is no technical signal of a change in the ongoing bearish trend. Short term, the 1 hour chart shows that the price is now below a mild bearish 20 SMA, whilst the technical indicators have recovered some from oversold territory, but turned flat well below their mid-lines. In the 4 hours chart, the 20 SMA maintains its bearish slope above the current level, whilst the technical indicators have been rejected from their mid-lines, and head lower, supporting further declines on renewed selling interest below the 1.5130 level.
 Support levels: 1.5130 1.5090 1.5060
Resistance levels: 1.5200 1.5245 1.5290
USD/JPY Current price: 119.91
View Live Chart for the USD/JPY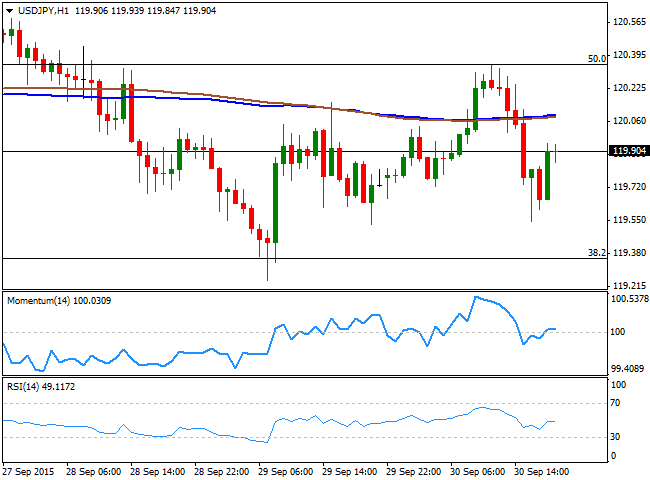
The Japanese yen fell during Asian hours, followings PM Abe comments on the need of adding further easing in a speech in New York, and the USD/JPY advanced up to a daily high of 120.34, reaching a strong Fibonacci resistance ahead of the US ADP release. Despite the US employment report resulted better-than-expected, the pair retreated from the mentioned technical level, falling down to 119.54 before bouncing back by the of the day. Still trading within its usual range, the 1 hour chart shows a limited upward potential, as the price is developing below its 100 and 200 SMAs, both around 120.10, whilst the technical indicators are now hovering around their mid-lines, lacking directional strength. In the 4 hours chart, the pair maintains the neutral stance seen on previous updates, and investors will likely wait for the release of the US Nonfarm Payroll report before trying to set a more directional trend.
Support levels: 120.00 119.70 119.35
Resistance levels: 120.35 120.70 121.05
AUD/USD Current price: 0.7010
View Live Chart for the AUD/USD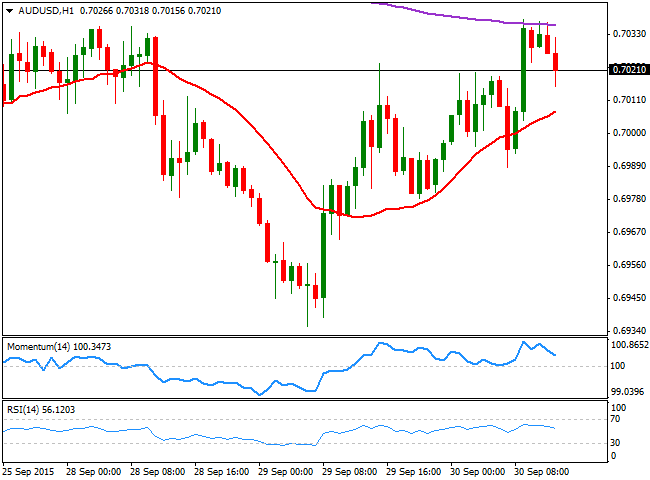
The Australian dollar recovered some ground this Wednesday, extending up to a daily high of 0.7037 against its American rival during the previous Asian session, following the strong recovery in stocks' markets. The pair however, was unable to extend its advance, weighed by a slump in precious metal prices, as spot gold lost $10.00. The pair however, holds above the 0.7000 figure, although the 1 hour chart shows an increasing downward potential, as the price is now below a bullish 20 SMA, whilst the Momentum indicator is crossing its mid-line towards the downside and the RSI indicator also heads lower, but around 50. In the 4 hours chart, the technical indicators are presenting a neutral stance, whilst the 20 SMA holds horizontal a few pips below the current level. Overall, the upside seems limited, although some follow through above 0.7040 should lead to additional recoveries, up to the 0.7110 price zone.
Support levels: 0.7000 0.6955 0.6930
Resistance levels: 0.7050 0.7080 0.7110
Information on these pages contains forward-looking statements that involve risks and uncertainties. Markets and instruments profiled on this page are for informational purposes only and should not in any way come across as a recommendation to buy or sell in these assets. You should do your own thorough research before making any investment decisions. FXStreet does not in any way guarantee that this information is free from mistakes, errors, or material misstatements. It also does not guarantee that this information is of a timely nature. Investing in Open Markets involves a great deal of risk, including the loss of all or a portion of your investment, as well as emotional distress. All risks, losses and costs associated with investing, including total loss of principal, are your responsibility. The views and opinions expressed in this article are those of the authors and do not necessarily reflect the official policy or position of FXStreet nor its advertisers. The author will not be held responsible for information that is found at the end of links posted on this page.
If not otherwise explicitly mentioned in the body of the article, at the time of writing, the author has no position in any stock mentioned in this article and no business relationship with any company mentioned. The author has not received compensation for writing this article, other than from FXStreet.
FXStreet and the author do not provide personalized recommendations. The author makes no representations as to the accuracy, completeness, or suitability of this information. FXStreet and the author will not be liable for any errors, omissions or any losses, injuries or damages arising from this information and its display or use. Errors and omissions excepted.
The author and FXStreet are not registered investment advisors and nothing in this article is intended to be investment advice.
Recommended Content
Editors’ Picks
EUR/USD edges lower toward 1.0700 post-US PCE

EUR/USD stays under modest bearish pressure but manages to hold above 1.0700 in the American session on Friday. The US Dollar (USD) gathers strength against its rivals after the stronger-than-forecast PCE inflation data, not allowing the pair to gain traction.
GBP/USD retreats to 1.2500 on renewed USD strength

GBP/USD lost its traction and turned negative on the day near 1.2500. Following the stronger-than-expected PCE inflation readings from the US, the USD stays resilient and makes it difficult for the pair to gather recovery momentum.
Gold struggles to hold above $2,350 following US inflation

Gold turned south and declined toward $2,340, erasing a large portion of its daily gains, as the USD benefited from PCE inflation data. The benchmark 10-year US yield, however, stays in negative territory and helps XAU/USD limit its losses.
Bitcoin Weekly Forecast: BTC’s next breakout could propel it to $80,000 Premium

Bitcoin’s recent price consolidation could be nearing its end as technical indicators and on-chain metrics suggest a potential upward breakout. However, this move would not be straightforward and could punish impatient investors.
Week ahead – Hawkish risk as Fed and NFP on tap, Eurozone data eyed too

Fed meets on Wednesday as US inflation stays elevated. Will Friday’s jobs report bring relief or more angst for the markets? Eurozone flash GDP and CPI numbers in focus for the Euro.