EUR/USD Current price: 1.2641
View Live Chart for the EUR/USD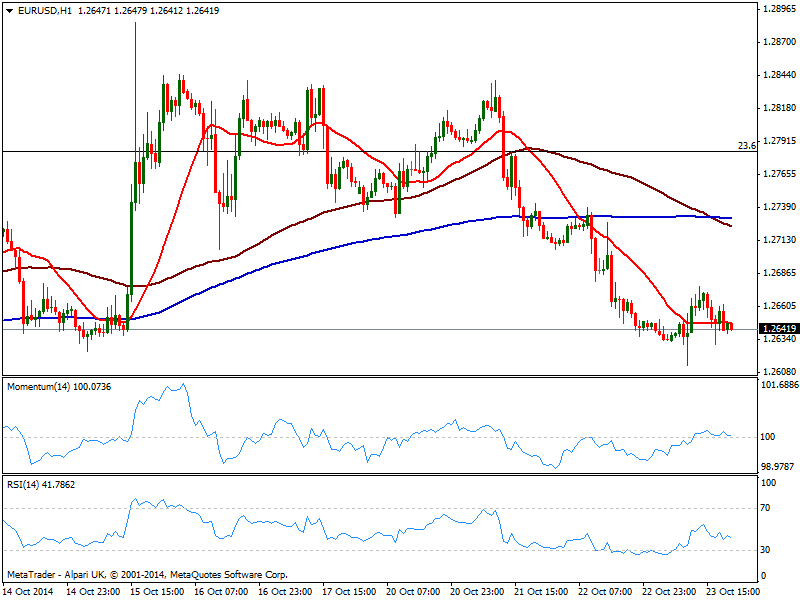
Solid gains amongst American indexes supported a mild advance in the greenback this Thursday that in some cases managed to extend to new week highs. In Europe, German and EZ PMIs came out better than expected, giving the common currency a short term boost up to 1.2676 against the greenback, yet the pair reverted most of such gains during early US hours. In the US, data was far from encouraging, pretty much in line with expected of even a couple ticks below, probably the only reason why dollar demand remained limited.
Nevertheless the EUR/USD maintains its weak tone, with the 1 hour chart showing price moving back and forth around a flat 20 SMA and indicators with a mild bearish slope in neutral territory, and the 4 hours chart presenting a strong bearish bias in its technical readings. The pair has been facing some buying interest in the 1.2610/20 price zone lately, so once those bulls give up, the downside will be exposed to a quick slide towards 1.2570 price zone. To the upside, the immediate short term resistance comes at 1.2660, with a break above it pointing for a retest of the 1.2700 figure as probable top for next Friday.
Support levels: 1.2620 1.2580 1.2550
Resistance levels: 1.2660 1.2700 1.2740
EUR/JPY Current price: 136.90
View Live Chart for the EUR/JPY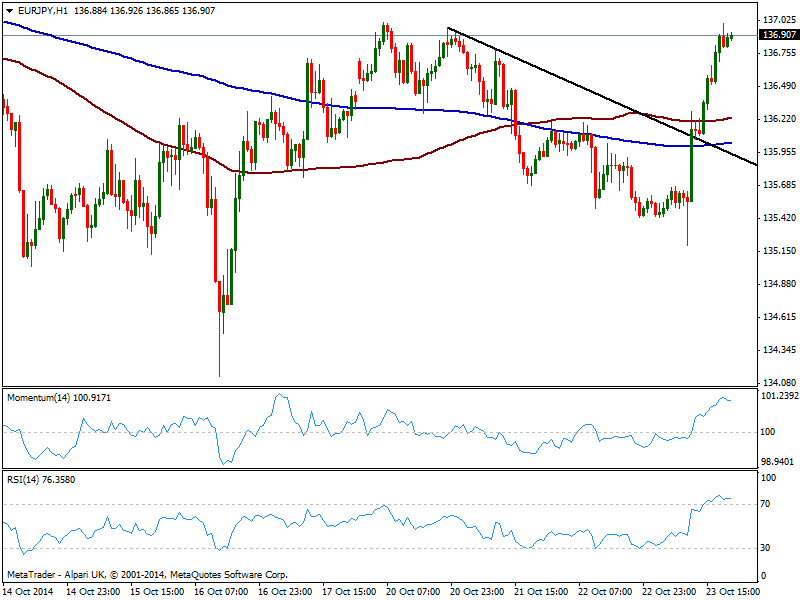
Yen was subject of a massive selloff against most rivals, with the EUR/JPY triggering stops and accelerating north several times on the day, and hardly looking back. DJIA added over 300 points on the day and the S&P added near 1.8%, while US 10Y notes yields tick higher, up to 2.29%: the perfect scenario for yen losses. The pair has broke above a short term descendant trend line, currently around 135.70, and the hourly chart shows price well above moving averages, both flat a handful of pips above and below the 136.00 figure, while indicators begin to give signs of exhaustion in overbought territory. In the 4 hours chart technical readings are biased higher barely crossing their midlines, with immediate support now in the 136.40 price zone: if the level holds on corrections, an upward acceleration should see the pair extending near 138.00 over this upcoming Friday.
Support levels: 136.40 136.00 135.35
Resistance levels: 137.05 137.55 138.00
GBP/USD Current price: 1.6029
View Live Chart for the GBP/USD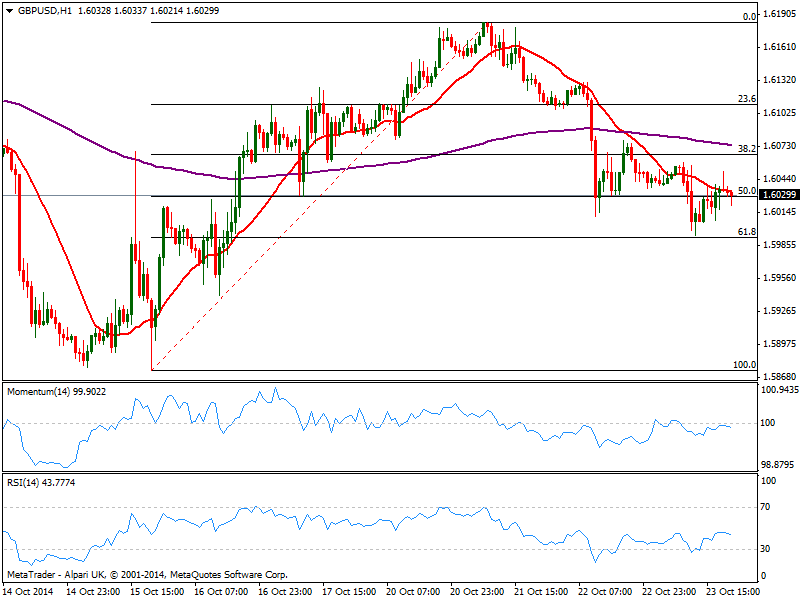
The GBP/USD flirted with the 1.6000 level after the release of weak UK Retail Sales, a confirmation the speed of economic growth suspected earlier on the year is not enough to anticipate a sooner rate hike. The pair however, found some buying interest around the critical figure, enough to make the pair bounce around 40 pips. Currently trading at the 50% retracement of its latest bullish run from 1.5874 to 1.6171, the hourly chart shows a bearish 20 SMA also around the Fibonacci level at 1.6030, while indicators present a mild negative tone below their midlines. In the 4 hours chart indicators remain well into negative territory, but losing the bearish strength seen earlier on the day, while 20 SMA maintains a strong bearish slope above current price. As long as below 1.6100, the risk to the downside is big with a break below 1.5995 pointing to a quick slide towards the 1.5940/50 price zone.
Support levels: 1.5995 1.5950 1.5910
Resistance levels: 1.6065 1.6090 1.6125
USD/JPY Current price: 108.14
View Live Chart for the USD/JPY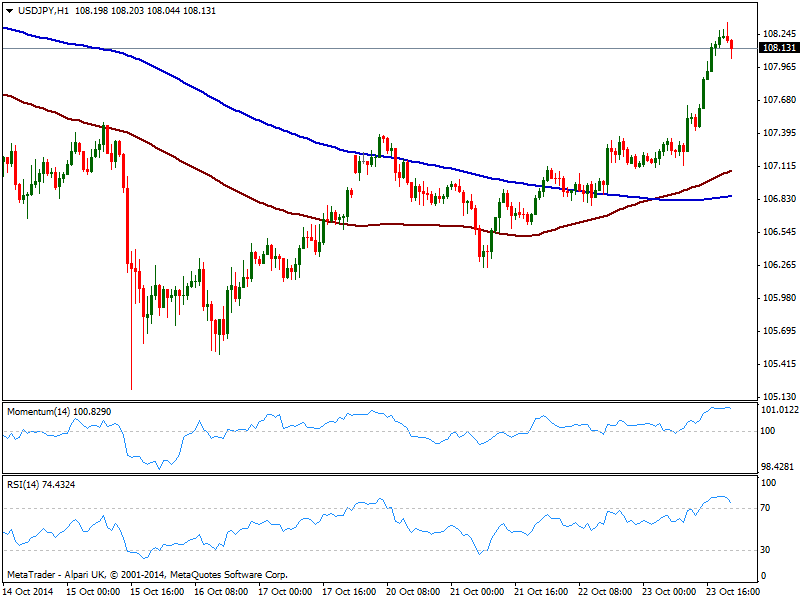
The USD/JPY surged up to 108.35, breaking through a couple of intraday resistances, now supports, without looking back. As in the case of EUR/JPY, stocks and yields advancing in the US was the main support for the pair now stable above 108.00. Short term, the 1 hour chart shows price well above 100 and 200 SMAs, with the shortest above the largest, and indicators turning lower in extreme overbought territory, not yet signaling a probable bearish correction. In the 4 hours chart technical readings are also losing upward strength in overbought territory, with 107.60 as the level to watch to add buys in case of retracements.
Support levels: 108.00 107.60 107.35
Resistance levels: 108.50 108.90 109.30
AUD/USD Current price: 0.8753
View Live Chart of the AUD/USD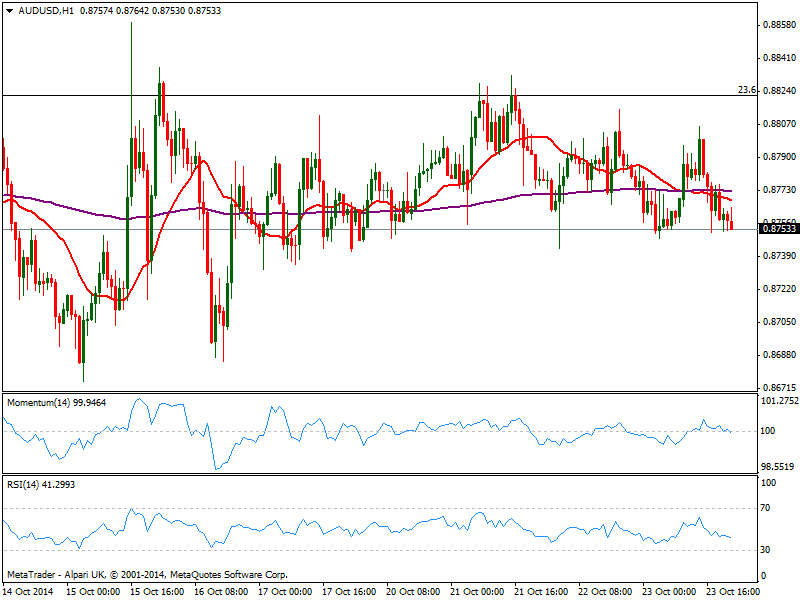
The AUD/USD trades near its daily low by US close, without nothing new to add to these last days view: the pair continues to trade in a limited range, albeit the 1 hour chart shows an increasing bearish potential, yet to be confirmed with a break below 0.8730 immediate support: price stands below a mild bearish 20 SMA as indicators turn lower around their midlines. In the 4 hours chart the picture is pretty much the same, with price hovering right below a flat 20 SMA and indicators gaining bearish slope below their midlines. Below mentioned support, the bearish movement may accelerate, with further slides below 0.8690 pointing to a test of 0.8640, base of the widest range.
Support levels: 0.8730 0.8690 0.8640
Resistance levels: 0.8770 0.8820 0.8860
Recommended Content
Editors’ Picks
EUR/USD edges lower toward 1.0700 post-US PCE

EUR/USD stays under modest bearish pressure but manages to hold above 1.0700 in the American session on Friday. The US Dollar (USD) gathers strength against its rivals after the stronger-than-forecast PCE inflation data, not allowing the pair to gain traction.
GBP/USD retreats to 1.2500 on renewed USD strength

GBP/USD lost its traction and turned negative on the day near 1.2500. Following the stronger-than-expected PCE inflation readings from the US, the USD stays resilient and makes it difficult for the pair to gather recovery momentum.
Gold struggles to hold above $2,350 following US inflation

Gold turned south and declined toward $2,340, erasing a large portion of its daily gains, as the USD benefited from PCE inflation data. The benchmark 10-year US yield, however, stays in negative territory and helps XAU/USD limit its losses.
Bitcoin Weekly Forecast: BTC’s next breakout could propel it to $80,000 Premium

Bitcoin’s recent price consolidation could be nearing its end as technical indicators and on-chain metrics suggest a potential upward breakout. However, this move would not be straightforward and could punish impatient investors.
Week ahead – Hawkish risk as Fed and NFP on tap, Eurozone data eyed too

Fed meets on Wednesday as US inflation stays elevated. Will Friday’s jobs report bring relief or more angst for the markets? Eurozone flash GDP and CPI numbers in focus for the Euro.