EUR/USD Current price: 1.2782
View Live Chart for the EUR/USD
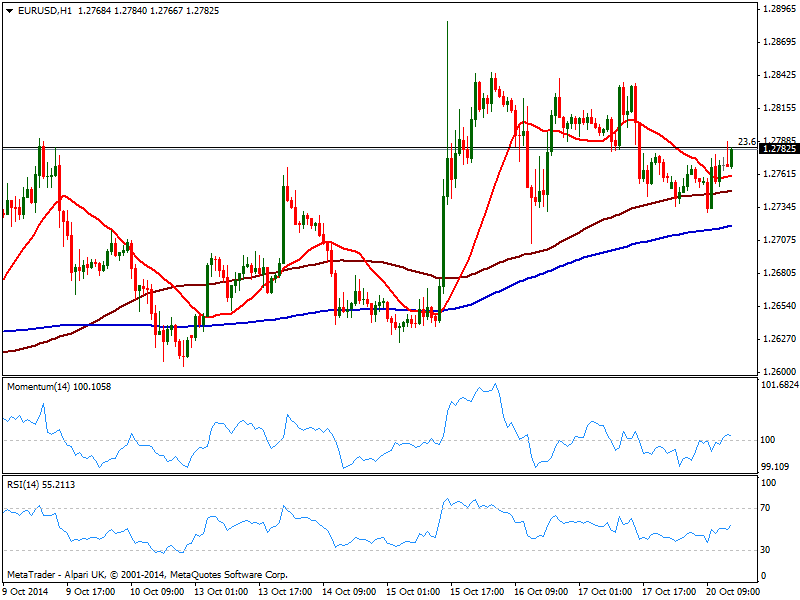
Dollar is under mild pressure across the board ahead of US opening, after FED’s Fisher hit the wires saying he doesn't see any reason not to curtail QE at October meeting, weighting on stocks: futures are again in the red, pointing for a negative opening. Technically the EUR/USD hourly chart shows price pressuring the daily high, also static Fibonacci resistance at 1.2780, as per being the 23.6% retracement of the 1.37/1.25 bearish run. Price stands above moving averages, while indicators had barely overcome their midlines, remaining directionless. In the 4 hours chart the technical picture is mixed, with a strong bearish momentum opposing a rising RSI and a bullish 20 SMA. Some follow through above 1.2790 should indicate further intraday gains towards 1.2845 price zone, while bears will take control only on a break below 1.2700.
Support levels: 1.2740 1.2700 1.2660
Resistance levels: 1.2790 1.2845 1.2890
GBP/USD Current price: 1.6143
View Live Chart for the GBP/USD
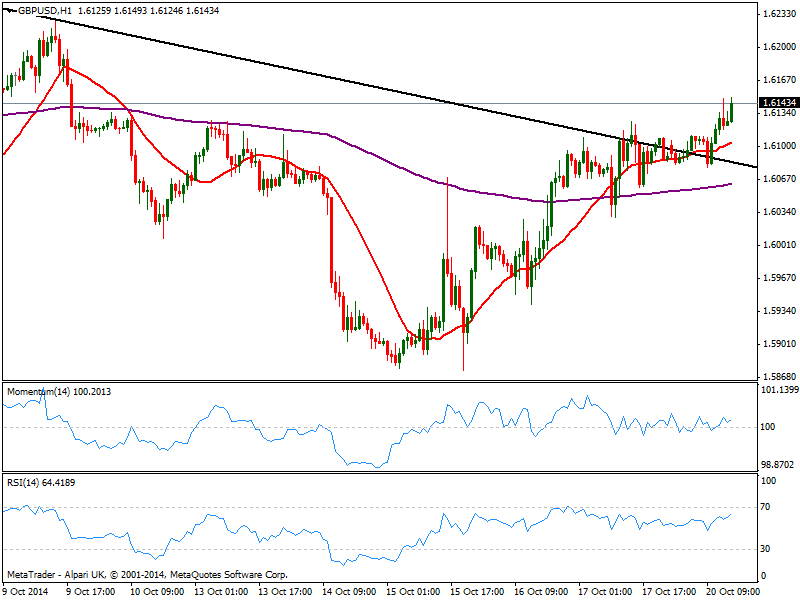
The GBP/USD trades at its daily high after finally breaching above 1.6125, level that contained the upside for most of these last 2 weeks. The hourly chart shows an increasing upward potential in the short term, as price holds above a bullish 20 SMA and indicator aim higher above their midlines. In the 4 hours chart technical indicators head higher in positive territory, while 20 SMA also accelerates north below current price, now offering short term support around 1.6060; as long as mentioned 1.6125 attracts buyers, the upside is favored with 1.6185 as next target once the daily high gives up.
Support levels: 1.6125 1.6060 1.6020
Resistance levels: 1.6150 1.6185 1.6220
USD/JPY Current price: 106.90
View Live Chart for the USD/JPY
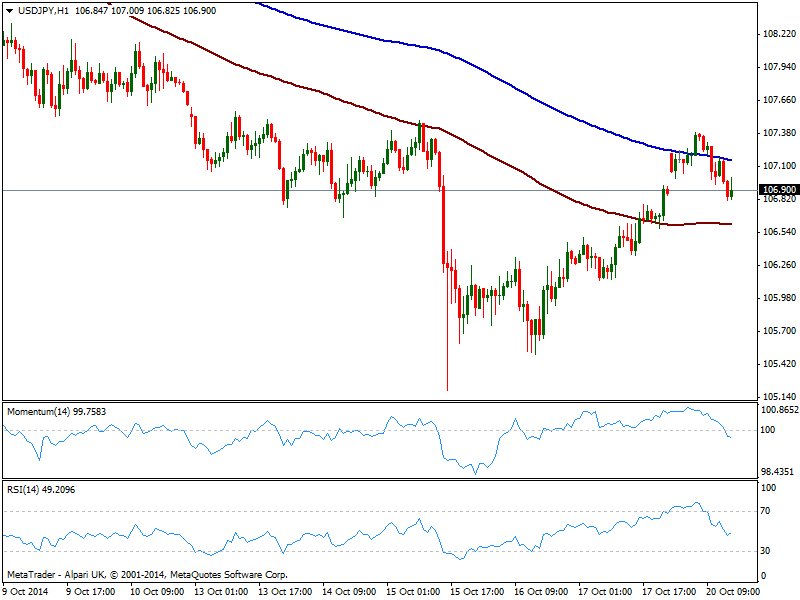
The USD/JPY lost the early day upward momentum over European hours, having advanced up to 107.38 before easing back. The 1 hour chart shows price heading lower between 100 and 200 SMAs, with the shortest offering intraday support at 106.60 and indicators heading lower below their midlines. In the 4 hours chart indicators turned south still above their midlines, while moving averages remain well above current price.
Support levels: 106.60 106.30 106.05
Resistance levels: 107.35 107.60 108.00
AUD/USD Current price: 0.8776
View Live Chart of the AUD/USD
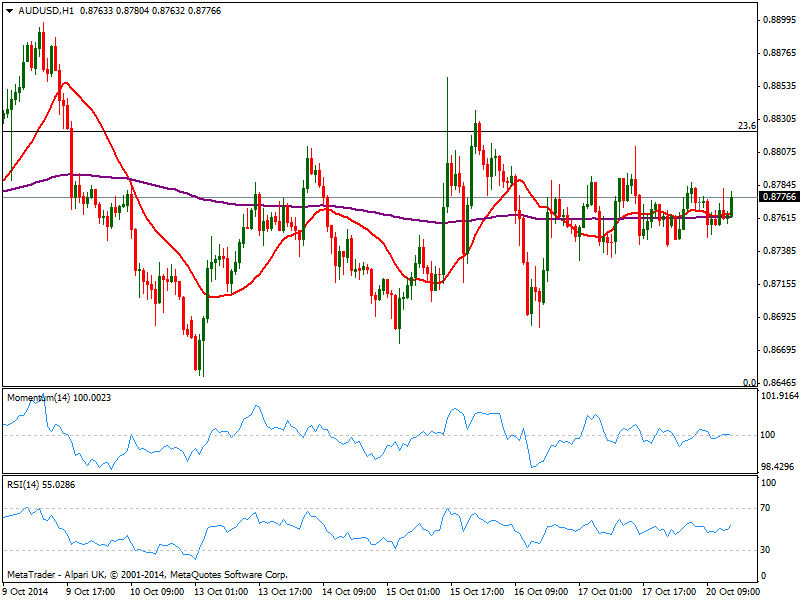
AUD/USD range stretched further, with the pair showing no directional strength in the short term. The hourly chart shows price above flat moving averages, and indicators horizontal in neutral territory, while the 4 hours chart shows indicators present a mild bearish tone but the neutral tone also prevails. As commented on previous updates, 0.8820 is the key resistance to overcome, while short term support stands at 0.8730 now.
Support levels: 0.8730 0.8690 0.8640
Resistance levels: 0.8790 0.8820 0.8860
Recommended Content
Editors’ Picks

EUR/USD consolidates weekly gains above 1.1150
EUR/USD moves up and down in a narrow channel slightly above 1.1150 on Friday. In the absence of high-tier macroeconomic data releases, comments from central bank officials and the risk mood could drive the pair's action heading into the weekend.

GBP/USD stabilizes near 1.3300, looks to post strong weekly gains
GBP/USD trades modestly higher on the day near 1.3300, supported by the upbeat UK Retail Sales data for August. The pair remains on track to end the week, which featured Fed and BoE policy decisions, with strong gains.

Gold extends rally to new record-high above $2,610
Gold (XAU/USD) preserves its bullish momentum and trades at a new all-time high above $2,610 on Friday. Heightened expectations that global central banks will follow the Fed in easing policy and slashing rates lift XAU/USD.

Week ahead – SNB to cut again, RBA to stand pat, PCE inflation also on tap
SNB is expected to ease for third time; might cut by 50bps. RBA to hold rates but could turn less hawkish as CPI falls. After inaugural Fed cut, attention turns to PCE inflation.

Bank of Japan set to keep rates on hold after July’s hike shocked markets
The Bank of Japan is expected to keep its short-term interest rate target between 0.15% and 0.25% on Friday, following the conclusion of its two-day monetary policy review. The decision is set to be announced during the early Asian session.

Moneta Markets review 2024: All you need to know
VERIFIED In this review, the FXStreet team provides an independent and thorough analysis based on direct testing and real experiences with Moneta Markets – an excellent broker for novice to intermediate forex traders who want to broaden their knowledge base.