EUR/USD Current price: 1.2834
View Live Chart for the EUR/USD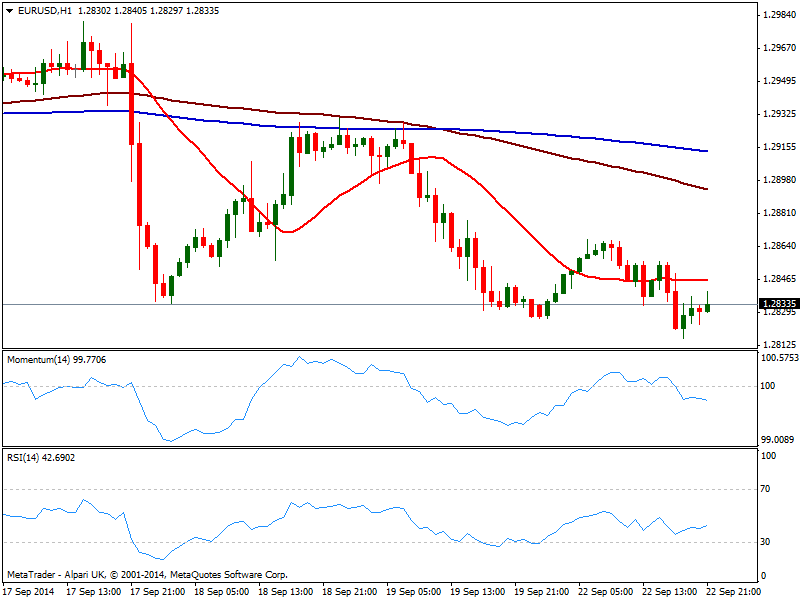
It was a quiet Monday across the forex board, yet pretty different among commodities and stocks, with indexes in Europe and the US broadly lower, and gold and oil trading at year lows. Draghi’s testimony ended up with no news, as he said that monetary policy will remain loose until inflation approaches the 2% target; in the US, Existing Home sales came out worse than expected, probably preventing dollar from claiming adepts on the day. Nevertheless, the EUR/USD fell to a new year low of 1.2816, with the bearish trend still quite in place. Short term, price develops below a flat 20 SMA as momentum grinds lower into negative territory, according to the hourly chart, with RSI stable around 44.00 In the 4 hours chart indicators retraced from there midlines, with 20 SMA now around 1.2865 daily high, acting as immediate intraday resistance. Further slides are expected below 1.2810, will main bearish target set as on previous updates at 1.2740.
Support levels: 1.2810 1.2770 1.2840
Resistance levels: 1.2865 1.2910 1.2950
EUR/JPY Current price: 139.69
View Live Chart for the EUR/JPY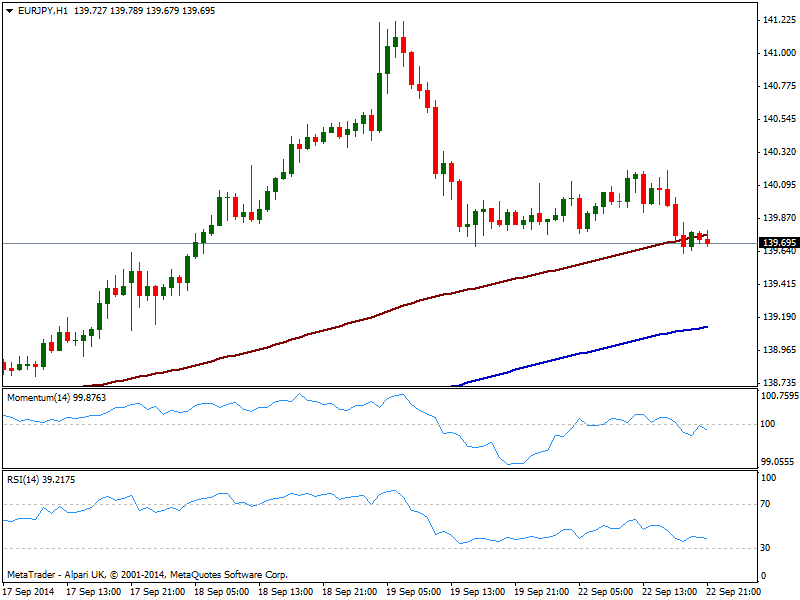
Yen crosses had eased some, weighted by the negative sentiment among stocks, yet the pullbacks had been limited, which reflects how weak the yen remains. As for the EUR/JPY, the pair failed to maintain the 140.00 and trades near its daily low by US close, with the 1 hour chart showing indicators turning lower below their midlines, not showing a strong bearish momentum at the time being, and price trying to break below 100 SMA, a few pips above current price. In the 4 hours chart indicators present a strong bearish slope and approach their midlines, not yet signaling a bearish continuation. The bearish move can extend down to 139.20, without really affecting the overall positive trend, yet a break below should signal a deeper movement, at least in the short term. Further gains are now expected only on a recovery above 140.40 a bit too far away for this Tuesday.
Support levels: 139.50 139.20 138.60
Resistance levels: 140.00 140.40 140.80
GBP/USD Current price: 1.6353
View Live Chart for the GBP/USD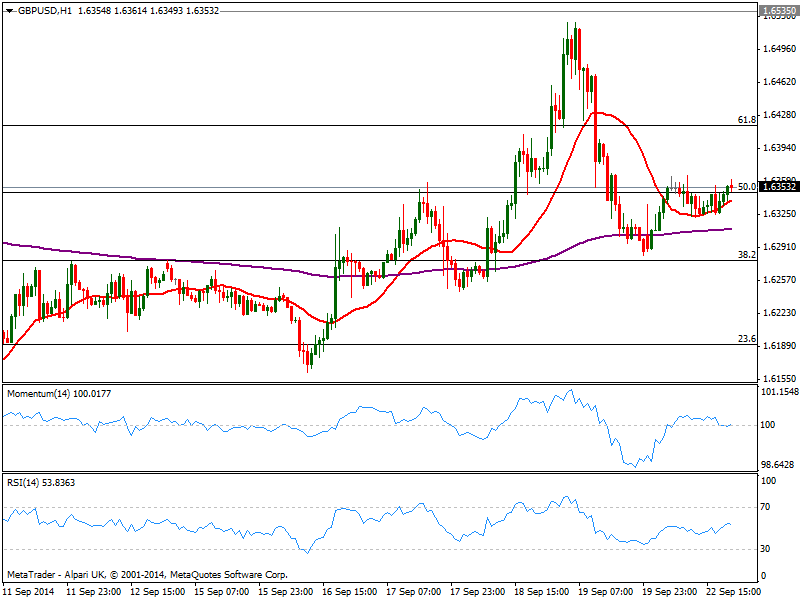
The GBP/USD has remained quite contained on Monday, hovering around the 50% retracement of early September bearish run at 1.6345, having done little either side of it. As a new day starts, the hourly chart maintains a quite neutral stance, with indicators flat around their midlines and price a few pips above an also flat 20 SMA. In the 4 hours chart 20 SMA converges with the Fibonacci level, with price moving back and forth around it for the last 24 hours. Indicators stand above their midlines but show no actual directional strength. Market still tries to digest the effects of the Scottish referendum, but for the most, Pound is not among the weakest currencies of the board, and the UK is also expected to “raise rates sooner than expected”: price needs to move away from current levels and find its way before a clearer directional trend surges again.
Support levels: 1.6300 1.6275 1.6220
Resistance levels: 1.6345 1.6410 1.6470
USD/JPY Current price: 108.80
View Live Chart for the USD/JPY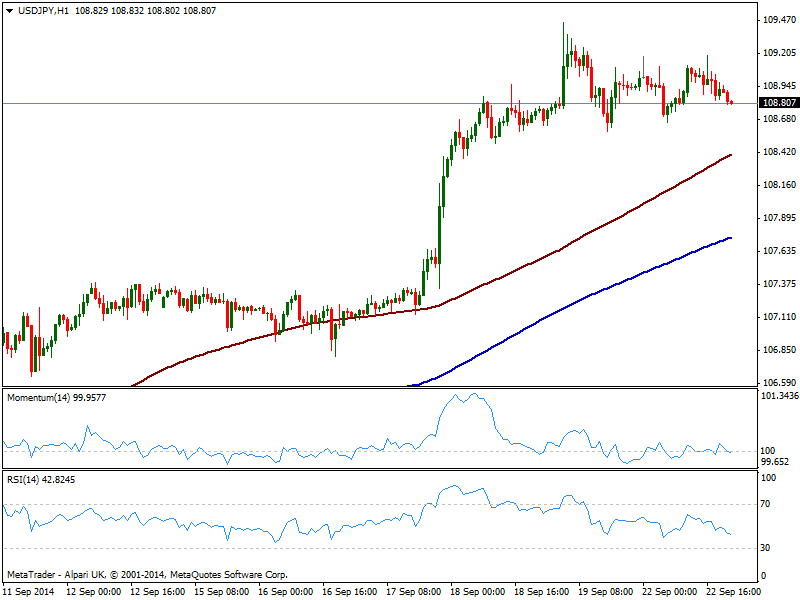
The USD/JPY is being weighted also by stocks, with the pair unable to firm up above 109.00 for most of the day, now trading in the red. But so far, the movements have been limited with buyer interest aligned at recent lows in the 108.50/60 price zone. The short term picture is quite neutral, with the 1 hour chart showing price well above 100 and 200 SMAs, both maintaining a strong bullish slope, and indicators around their midlines. In the 4 hours chart indicators had turned strongly south, with momentum approaching 100 and RSI below 70, but with no signs of downward continuation. Levels to watch are mentioned 108.55 price zone to the downside, and recent high of 109.45 to the upside: a break of any of them is required to see the pair establishing a firmer directional tone.
Support levels: 108.95 108.55 108.10
Resistance levels: 109.45 109.75 110.20
AUD/USD Current price: 0.8873
View Live Chart of the AUD/USD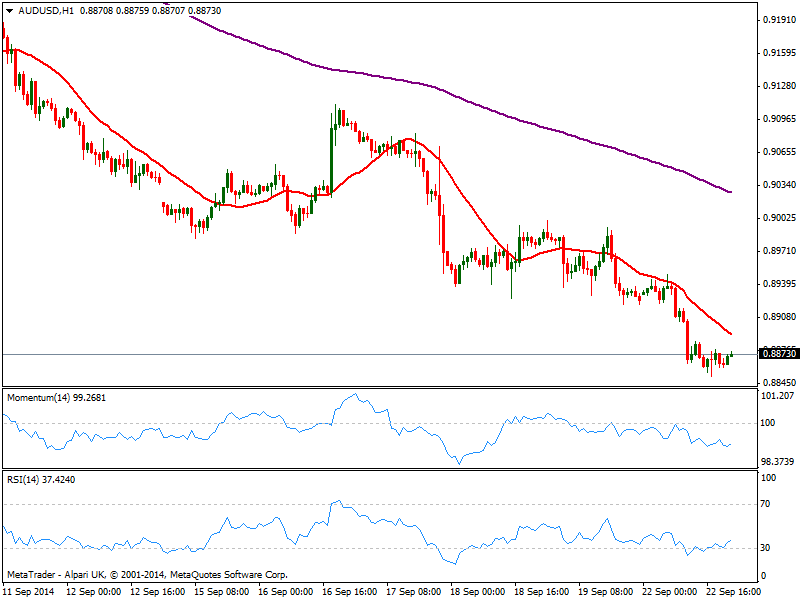
The AUD/USD remains near a fresh 7-month low set at 0.8852, with hourly indicators maintaining the bearish tone seen on previous updates, as per 20 SMA heading lower above current price and indicators steady near oversold territory. In the 4 hours chart RSI looks a bit exhausted in oversold levels, but momentum maintains a bearish slope, suggesting an upward movement will remain limited. 0.8910 is the key resistance for today, as only above this last the pair can shake off the strong bearish tone and be able to correct higher.
Support levels: 0.8830 0.8800 0.8770
Resistance levels: 0.8880 0.8910 0.8950
Recommended Content
Editors’ Picks
EUR/USD edges lower toward 1.0700 post-US PCE

EUR/USD stays under modest bearish pressure but manages to hold above 1.0700 in the American session on Friday. The US Dollar (USD) gathers strength against its rivals after the stronger-than-forecast PCE inflation data, not allowing the pair to gain traction.
GBP/USD retreats to 1.2500 on renewed USD strength

GBP/USD lost its traction and turned negative on the day near 1.2500. Following the stronger-than-expected PCE inflation readings from the US, the USD stays resilient and makes it difficult for the pair to gather recovery momentum.
Gold struggles to hold above $2,350 following US inflation

Gold turned south and declined toward $2,340, erasing a large portion of its daily gains, as the USD benefited from PCE inflation data. The benchmark 10-year US yield, however, stays in negative territory and helps XAU/USD limit its losses.
Bitcoin Weekly Forecast: BTC’s next breakout could propel it to $80,000 Premium

Bitcoin’s recent price consolidation could be nearing its end as technical indicators and on-chain metrics suggest a potential upward breakout. However, this move would not be straightforward and could punish impatient investors.
Week ahead – Hawkish risk as Fed and NFP on tap, Eurozone data eyed too

Fed meets on Wednesday as US inflation stays elevated. Will Friday’s jobs report bring relief or more angst for the markets? Eurozone flash GDP and CPI numbers in focus for the Euro.