EUR/USD Current price: 1.3636
View Live Chart for the EUR/USD
The EUR/USD posted a daily low of 1.3625 following better than expected and a strong upward revision of previous numbers in US Durable Goods Orders, after being on the winning side for most of the last two sessions. Stocks are strongly up across the world, but gold nose dives below the $1280 mark, keeping the dollar on demand against other currencies. Minor housing data also came out positive, although market players seem to be awaiting for Draghi speech at 13:30 GMT.
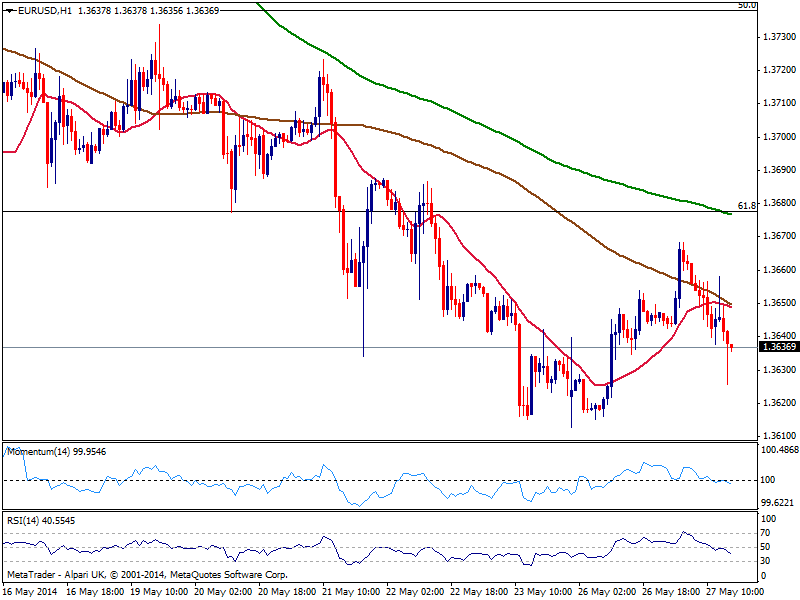
As for the EUR/USD hourly chart, price stands below 20 and 100 SMAs, both converging now in the 1.3650 level and offering immediate resistance while indicators aim lower around their midlines, lacking actual strength. In the 4 hours chart a mild bearish tone is also present, with price back below a bearish 20 SMA and indicators heading lower also around their midlines. The lows around 1.3610 are still the level to break to confirm a downward extension, eyeing then 1.3520/40 price zone as next big support.
Support levels: 1.3610 1.3570 1.3535
Resistance levels: 1.3650 1.3680 1.3720
GBP/USD Current price: 1.6815
View Live Chart for the GBP/USD
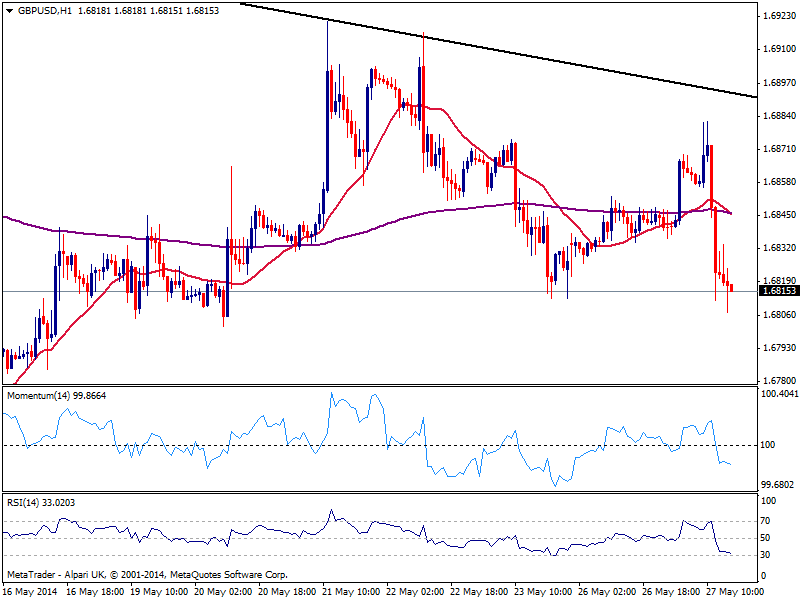
The GBP/USD trades near past week lows, having suffered a kneejerk after the release of worse than expected mortgage approvals data. The pair is biased lower in the short term, as the hourly chart shows a strong acceleration below 20 SMA, and indicators gaining bearish tone in negative territory. In the 4 hours chart price struggles around a flat 200 EMA, while indicators accelerate lower below their midlines, keeping the pressure to the downside: a break below 1.6801 past week low should anticipated more falls, looking for a test of 1.6730, past May 15th daily low.
Support levels: 1.6810 1.6770 1.6730
Resistance levels: 1.6840 1.6885 1.6920
USD/JPY Current price: 101.90
View Live Chart for the USD/JPY
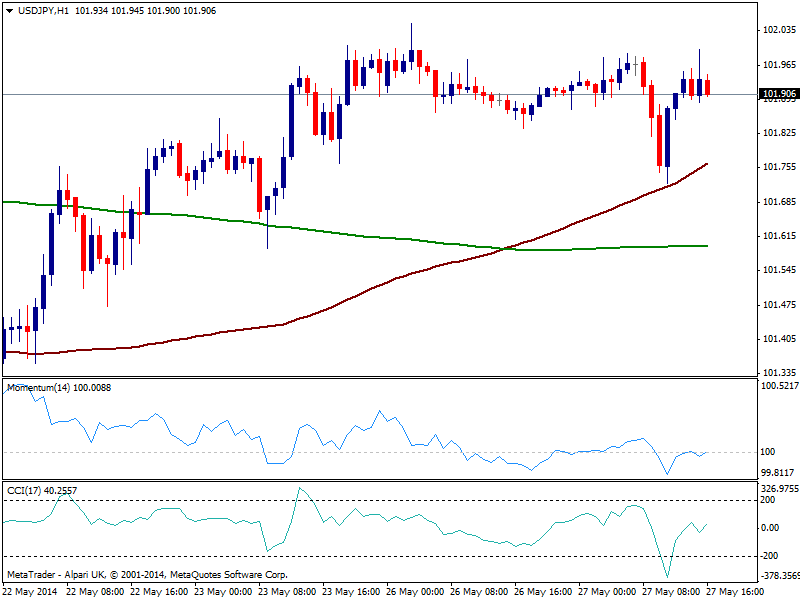
The USD/JPY keeps hovering right below the 102.00 level, unable to break higher but with limited retracements after a couple of intraday tests. The hourly chart shows latest deep found support in a bullish 100 SMA, currently offering short term support around 101.70, while indicators aim higher, albeit momentum presents a quite neutral stance. In the 4 hours chart the technical picture is bullish, yet as commented on previous updates, steady gains above the critical figure are required to confirm a new leg up.
Support levels: 101.60 101.20 100.70
Resistance levels: 102.00 102.35 102.70
AUD/USD Current price: 0.9261
View Live Chart for the AUD/USD
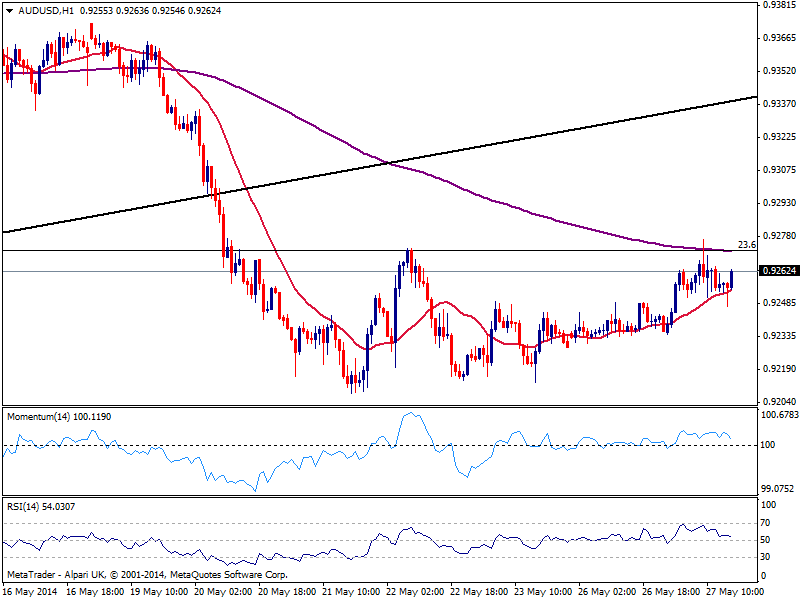
Australian dollar is proving strong this Tuesday, as per its latest recovery up to current levels against the greenback. Despite the strong selloff in gold, the AUD/USD recovered from a session low of 0.9246 and approaches 0.9270 price zone, immediate Fibonacci resistance. The hourly chart shows price bouncing from a slightly bullish 20 SMA but indicators losing upward potential still above their midlines. In the 4 hours chart the picture is quite alike, with the positive tone lacking momentum at the time being.
Support levels: 0.9200 0.9170 0.9135
Resistance levels: 0.9240 0.9270 0.9310
Recommended Content
Editors’ Picks
EUR/USD declines below 1.0700 as USD recovery continues

EUR/USD lost its traction and declined below 1.0700 after spending the first half of the day in a tight channel. The US Dollar extends its recovery following the strong Unit Labor Costs data and weighs on the pair ahead of Friday's jobs report.
GBP/USD struggles to hold above 1.2500

GBP/USD turned south and dropped below 1.2500 in the American session on Thursday. The US Dollar continues to push higher following the Fed-inspired decline on Wednesday and doesn't allow the pair to regain its traction.
Gold stuck around $2,300 as market players lack directional conviction

Gold extended its daily slide and dropped below $2,290 in the second half of the day on Thursday. The benchmark 10-year US Treasury bond yield erased its daily losses after US data, causing XAU/USD to stretch lower ahead of Friday's US jobs data.
Top 3 Price Prediction BTC, ETH, XRP: Altcoins to pump once BTC bottoms out, slow grind up for now

Bitcoin reclaiming above $59,200 would hint that BTC has already bottomed out, setting the tone for a run north. Ethereum holding above $2,900 keeps a bullish reversal pattern viable despite falling momentum. Ripple coils up for a move north as XRP bulls defend $0.5000.
Happy Apple day

Apple is due to report Q1 results today after the bell. Expectations are soft given that Apple’s Chinese business got a major hit in Q1 as competitors increased their market share against the giant Apple.