![]() Nadia Simmons
Nadia Simmons
Sunshine Profits
In the previous month, crude oil extended gains and climbed above the barrier of $40. Despite this improvement, the combination of resistance levels encouraged oil bears to act, which resulted in erasing 40% of the previous upward move. What happened at the same time with oil stocks? What’s next for the XOI? Let’s jump right into charts and find out what can we infer from them about future moves.
Let’s start today’s article with the long-term chart of oil stocks.
_20160411162741.png)
In our previous Oil Investment Update, we wrote that the XOI had invalidated earlier breakdown under the previous lows and the 200-month moving average, which suggested further improvement and an increase to the previously-broken black resistance line around 1,070. Looking at the monthly chart from today’s point of view, we see that the situation developed in line with the above scenario and oil stocks almost touched our upside target. Despite this improvement, oil bulls didn’t manage to push the XOI higher, which resulted in a reversal earlier this month. As you see, the index gave up some gains, which suggests that the recent upward move could be just a verification of earlier breakdown under the black resistance line. If this is the case, we may see declines in the coming month and a re-test of the 200-month moving average. At this point, some of you may ask: what about buying signals generated by the CCI and Stochastic Oscillator? As you see on the monthly chart, we saw similar signals at the beginning of Feb 2015. Back then, they didn’t trigger significant upward move and, from today’s point of view, increases between Feb and May were just a correction of earlier downward move. Therefore, in our opinion, they are not reliable enough.
But are there any other factors that could encourage oil bears to act? Let’s examine the weekly chart and find out what can we infer from it.
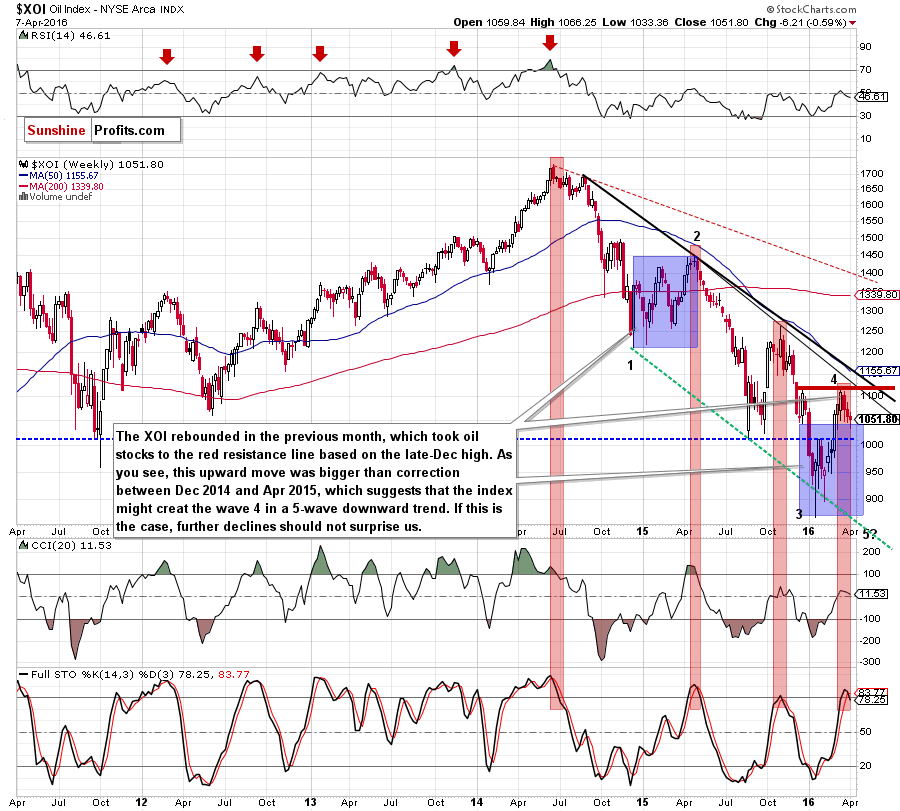
From this perspective, we see that the recent upward move took oil stocks to the red resistance line based on the late-Dec high. As you see it was bigger than correction between Dec 2014 and Apr 2015, which suggests that the index might create a wave 4 in a 5-waves downward trend (according to Elliott wave theory). If this is the case, further declines in the coming weeks should not surprise us – especially when we factor in sell signals generated by the Stochastic Oscillator. Is it more reliable than monthly indicator? In our opinion, it is, because all sell signals generated since 2014 preceded sizable downward moves, which increases the probability that we’ll see similar price action later this month.
Will the very short-term picture confirm this scenario? Let’s check the daily chart.
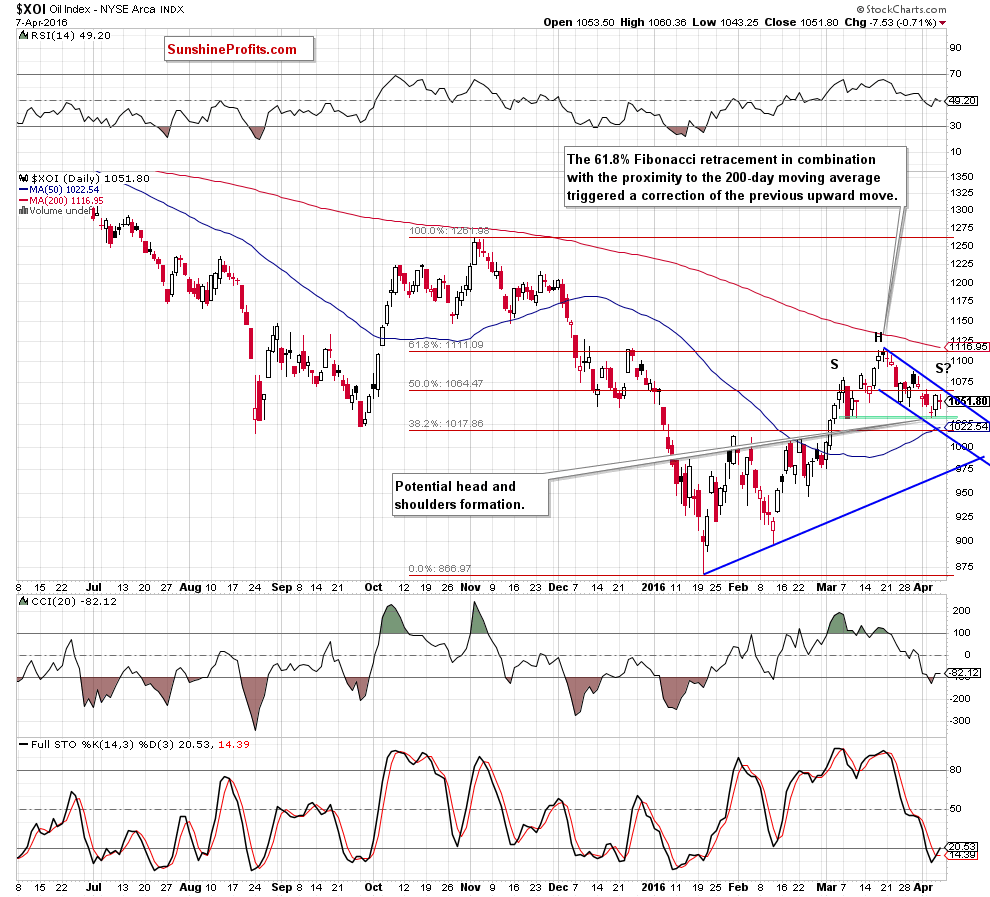
On the very short-term chart, we see that oil stocks rebounded and increased to the 61.8% Fibonacci retracement and the late-Dec high. This resistance zone encouraged oil bears to act, which resulted in a drop to the bottom of the early-March pullback. As you see, this support triggered a rebound in recent days, but despite this improvement, oil stocks remain in the blue declining trend channel. What’s next? When we take a closer look at the chart, we can notice a potential head and shoulders formation. This means that a breakdown under the green zone could result in a drop to around 950, where the size of the move will correspond to the height of the formation (in this area is also the Feb 24 low). Nevertheless, we should keep in mind that the CCI and Stochastic Oscillator generated buy signals, which could encourage oil bulls to act – similarly to what we saw in late-Jan. If this is the case, and the XOI rebounds from here, we’ll likely see a test of the March high and the 200-day moving average in the coming days.
Summing up, oil stocks pulled back to the first support zone, which could trigger a rebound (especially when we factor in buy signals generated by the CCI and Stochastic Oscillator) to the March high and the 200-day moving average in the coming days. Nevertheless, even if we see such improvement, we should keep in mind the long- and medium-term picture, which suggests that further deterioration in the second half of the month is very likely.
All essays, research and information found above represent analyses and opinions of Przemyslaw Radomski, CFA and Sunshine Profits' employees and associates only. As such, it may prove wrong and be a subject to change without notice. Opinions and analyses were based on data available to authors of respective essays at the time of writing. Although the information provided above is based on careful research and sources that are believed to be accurate, Przemyslaw Radomski, CFA and his associates do not guarantee the accuracy or thoroughness of the data or information reported. The opinions published above are neither an offer nor a recommendation to purchase or sell any securities. Mr. Radomski is not a Registered Securities Advisor. By reading Przemyslaw Radomski's, CFA reports you fully agree that he will not be held responsible or liable for any decisions you make regarding any information provided in these reports. Investing, trading and speculation in any financial markets may involve high risk of loss. Przemyslaw Radomski, CFA, Sunshine Profits' employees and affiliates as well as members of their families may have a short or long position in any securities, including those mentioned in any of the reports or essays, and may make additional purchases and/or sales of those securities without notice.
Recommended Content
Editors’ Picks
USD/JPY holds near 155.50 after Tokyo CPI inflation eases more than expected

USD/JPY is trading tightly just below the 156.00 handle, hugging multi-year highs as the Yen continues to deflate. The pair is trading into 30-plus year highs, and bullish momentum is targeting all-time record bids beyond 160.00, a price level the pair hasn’t reached since 1990.
AUD/USD stands firm above 0.6500 with markets bracing for Aussie PPI, US inflation

The Aussie Dollar begins Friday’s Asian session on the right foot against the Greenback after posting gains of 0.33% on Thursday. The AUD/USD advance was sponsored by a United States report showing the economy is growing below estimates while inflation picked up.
Gold soars as US economic woes and inflation fears grip investors

Gold prices advanced modestly during Thursday’s North American session, gaining more than 0.5% following the release of crucial economic data from the United States. GDP figures for the first quarter of 2024 missed estimates, increasing speculation that the US Fed could lower borrowing costs.
Stripe looks to bring back crypto payments as stablecoin market cap hits all-time high

Stripe announced on Thursday that it would add support for USDC stablecoin, as the stablecoin market exploded in March, according to reports by Cryptocompare.
Bank of Japan expected to keep interest rates on hold after landmark hike

The Bank of Japan is set to leave its short-term rate target unchanged in the range between 0% and 0.1% on Friday, following the conclusion of its two-day monetary policy review meeting for April. The BoJ will announce its decision on Friday at around 3:00 GMT.