EUR/USD
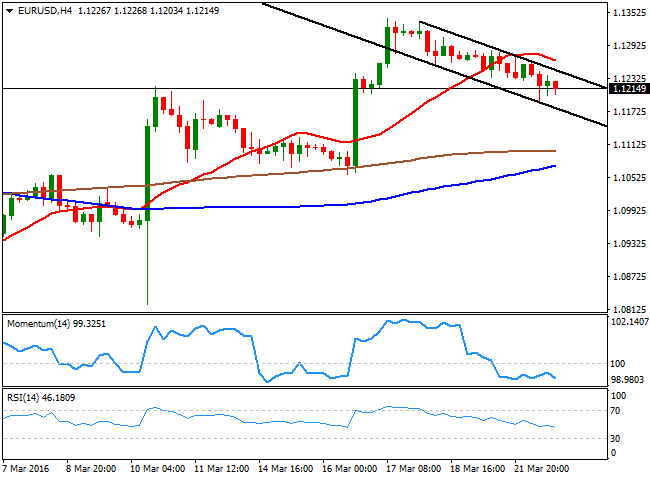
Risk aversion dominated the European session, as terrorism stroke again in Europe, this time in Brussels. Bombings were reported in the airport and some metro stations, again attributed to ISIS extremists. The attacks fueled risk aversion at the London opening, resulting in a dollar rally against its European rivals, which persisted all through the day. Macroeconomic releases had little effect on the market at the time, but data coming from Europe generally surprised to the upside, as PMIs readings for March beat previous month numbers, with the Services sector clearly outperforming the manufacturing one. German Manufacturing PMI did disappoint slightly, falling from 50.5 to 50.4, but the IFO confidence index rebounded in March to 106.7, from 105.7 in March. In the US, the Markit manufacturing PMI showed that growth in the sector is still subdued, as the figure was marginally up from 51.3 in February to current 51.4, whilst the Richmond FED manufacturing index bounced in March, from previous 4 to 22, showing that at least, local manufacturing activity expanded.The EUR/USD fell as low as 1.1187 before recovering the 1.1200 level, having spent most of the American session consolidating above this last. The pair now develops within a descendant channel, which roof stands at 1.1230/40 for this Wednesday. The previous bullish trend has been affected with this retracement, although it will take a clear break below the 1.1100/20 region, a major static support, to confirm a shift towards the downside. In the meantime, the 4 hours chart presents a marked bearish tone, given that the 20 SMA has turned sharply lower above the current level, whilst the technical indicators keep heading south below their midlines. A recovery above 1.1245, however, should see the pair resuming its advance, and probably regaining the 1.1300 level.
Support levels:1.1200 1.1160 1.1120
Resistance levels: 1.1245 1.1290 1.1340
GBP/USD
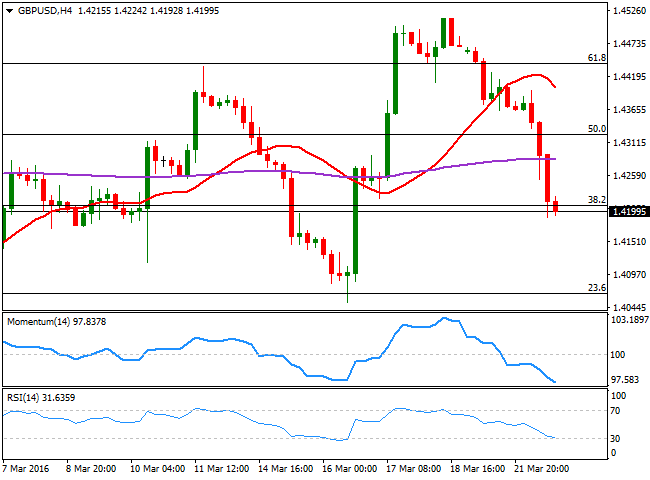
The Pound was among the worst daily performers, sharply lower after the London's opening bell as new terrorism attacks in Europe fueled risk of a Brexit. The pair fell initially to 1.4251, before the UK reported softerthanexpected inflation, which end up fueling the decline of the pair. Headline CPI rose 0.2%, below market's consensus, leaving the yearoveryear rate unchanged at 0.3%. The core rate was unchanged at 1.2%. Also, the Input prices for producers was below expected while output price was not quite as soft as forecast. The GBP/USD pair bottomed at 1.4189 daily basis, and has spent most of the US session consolidating around 1.4200, with short term selling interest surging on approaches to the 1.4250 level, now the immediate resistance. Short term, the 1 hour chart shows that the technical indicators maintain their bearish slopes within oversold levels, whilst the 20 SMA maintains a strong bearish slope well above the current level. In the 4 hours chart, the price has accelerated below its 200 EMA, and is currently attached to the 38.2% retracement of this year's decline, while the technical indicators maintain strong bearish slopes near oversold levels, all of which supports additional declines towards 1.4160 first, the immediate support.
Support levels: 1.4160 1.4120 1.4075
Resistance levels: 1.4250 1.4290 1.4330
USD/JPY
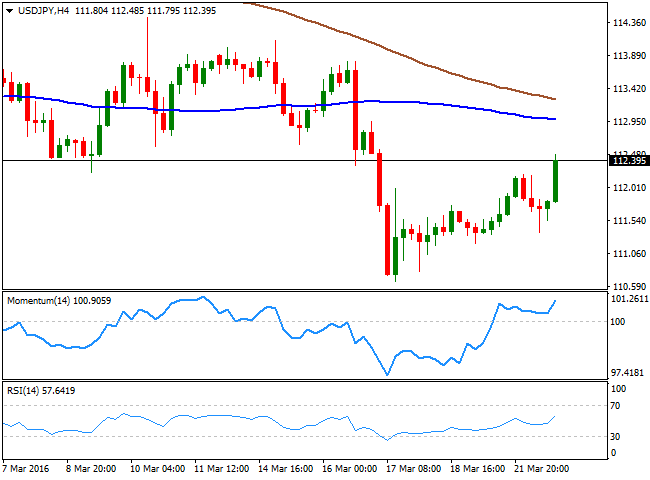
The USD/JPY trades at its highest in 3 days and near a daily high set at 112.48, with the Japanese yen under pressure amid poor local data. Japan’s March manufacturing PMI released at the beginning of the day, printed 49.1 against 50.5 expected and compared to 50.1 in February. An initial rally beyond 112.00 was erased by a bout of risk aversion at the beginning of the European session, but as stocks turned green, the pair jumped higher. Still far from reversing the long term bearish trend, the short term picture favors some additional gains as in the 1 hour chart, the price has recovered above its 100 SMA, while the technical indicators are currently losing upward strength near overbought territory, due to the diminishing volumes at this time of the day, rather than to suggest a bearish move. In the 4 hours chart, the Momentum indicator bounced sharply higher from its 100 level while the RSI indicator also heads north within positive territory, supporting a continued rally, should Asian shares emulate their American counterparts.
Support levels: 112.10 111.70 111.30
Resistance levels: 112.45 112.90 113.30
GOLD
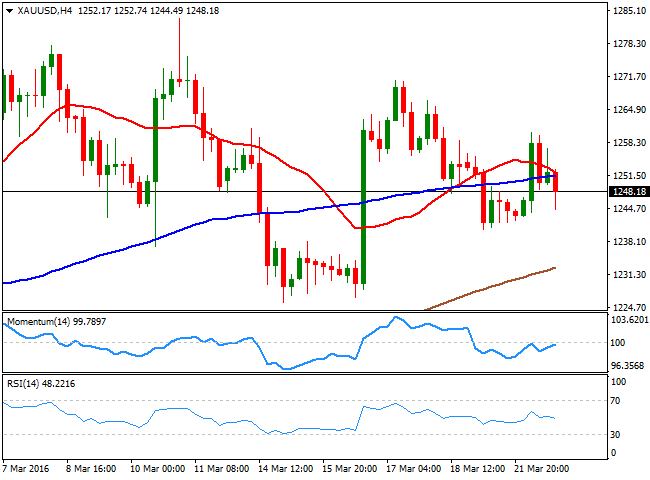
Gold prices surged early Europe on news of explosions in Brussels, although the commodity gave back most of its daily gains, and spot closed modestly higher around $1,247.50 a troy ounce. Gold for April delivery traded as high as $1,260.90, before market's negative mood reversed, weighing on the bright metal. Nevertheless, and from a technical point of view, bulls maintain the technical advantage, as the price continues consolidating near its recent multimonth high set around 1,283.50, with no signs that the trend will post a uturn. Daily basis, the price failed to recover above a mild bullish 20 SMA, while the technical indicators have lost their bearish strength around their midlines, supporting some upcoming consolidation. In the 4 hours chart, the price is currently a few cents below a bearish 20 SMA, while the technical indicators diverge around their midlines, also in line with some consolidative moves, as no clear direction comes from them at the time being.
Support levels:1,240.50 1,233.15 1.225.00
Resistance levels: 1,254.40 1,265.40 1,273.90
WTI CRUDE
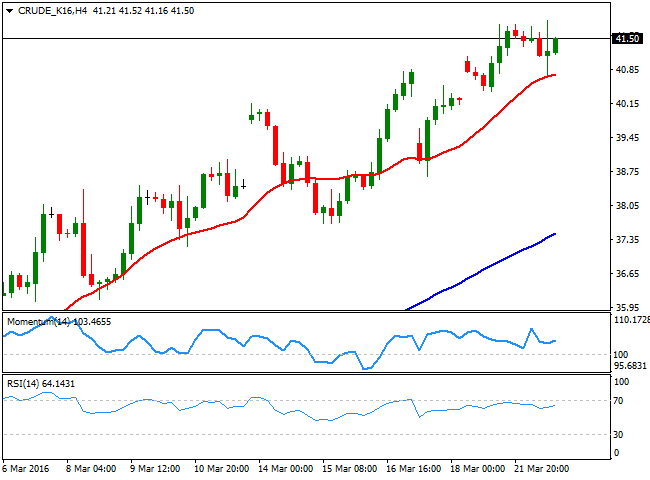
Crude oil prices saw little action this Tuesday, with US WTI futures ending the day pretty much flat around $41.50 a barrel. The commodity saw some limited intraday pressure on news saying that Libya will not be attending the upcoming gathering of world's oil producers to discuss a deal on freezing output next April. In the meantime, and ahead of US stockpiles releases, the daily chart shows that the price of black gold holds above its 200 SMA, while the technical indicators have turned flat in overbought levels, in line with the latest consolidation, and far from suggesting the commodity will change bias. In the 4 hours chart, an intraday slide down to the 20 SMA was quickly reversed, with the dynamic support standing now at 40.75. The technical indicators in this last time frame present limited upward slopes within positive territory, helping in keep the downside limited.
Support levels: 40.75 40.10 39.40
Resistance levels: 41.75 42.50 43.20
DAX
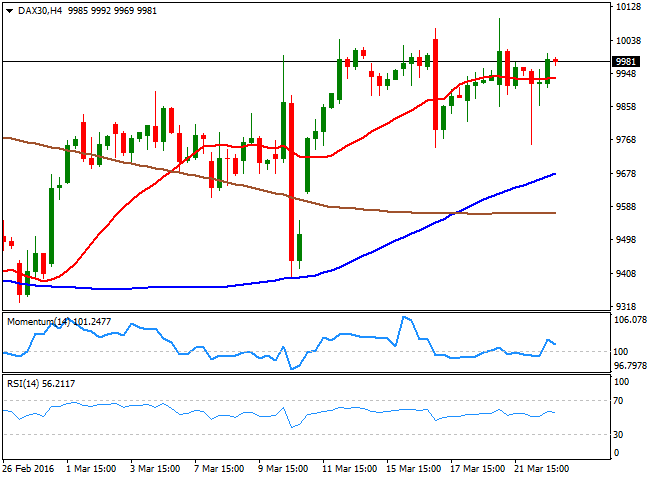
European shares plummeted at the opening, but pared losses and reversed before London's close, with the German DAX ending the day at 9,990.00, up by 41 points, supported by reports showing that German business sentiment improved in March, as according to the IFO Institute, the business climate index rose to 106.7 from 105.7 in February, above market's expectations. Stocks reacted negatively at the beginning of the day to the terror attacks in Brussels, which end up dragging the travel and leisure sectors lower across the EU. From a technical point of view, the daily chart for the DAX shows that the index bounced sharply after testing its daily 20 SMA, while the technical indicators have lost their bearish slopes and hold flat within positive territory, limiting chances of an upcoming slide. In the 4 hours chart, the index keeps hovering around a horizontal 20 SMA, while the technical indicators have partially lost their bullish strength, but remain in positive territory. The index has failed to extend gains beyond the 10,000 figure in spite of several attempts seen during this March, having been as high as 10,097 in intraday spikes. A break above this last is then required to confirm a more constructive outlook in the index.
Support levels: 9,959 9,891 9,839
Resistance levels: 10,060 10,118 10,200
DOW JONES
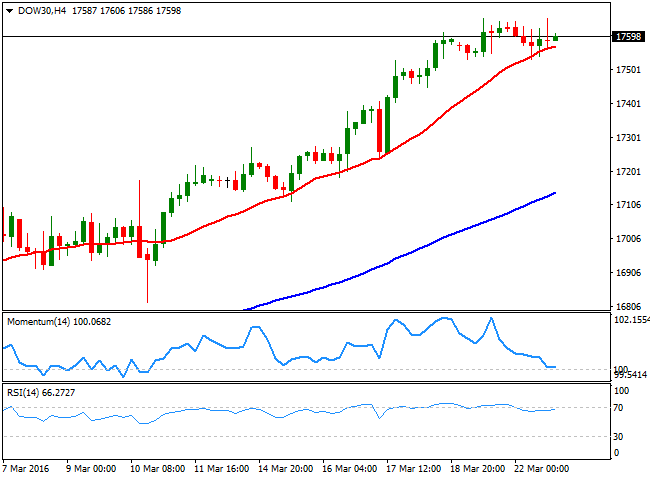
Wall Street closed mixed, with market's sentiment weighed by Brussels' terror attacks. The Dow Jones Industrial average closed down 41 points at 17,582.57, snapping a 7day winning streak, the Nasdaq added 12 points to end at 4,821.55, while the SandP lost 0.09% to close at 2,049.80. An advance in the healthcare sector outpaced declines in consumer and telecom stocks, helping the indexes to erase their early losses. The daily chart shows that the pair traded within Monday's range, maintaining the positive tone seen over the past weeks. The technical indicators are still consolidating within overbought levels, whilst the 20 DMA continues heading north above the 100 and 200 DMAs, supporting a continued advance. In the 4 hours chart, the Momentum indicator has turned neutral around its 100 level, the RSI also lacks directional strength, but near overbought readings, whilst the index consolidates a few points above its 20 SMA, overall neutral.
Support levels: 17,596 17,533 17,449
Resistance levels: 17,644 17,728 17,800
FTSE 100
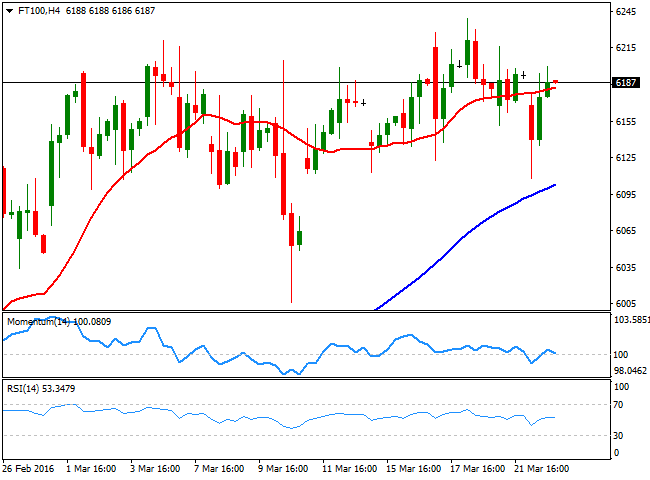
The FTSE 100 managed to close with gains, up by 8 points to end at 6,192.74, erasing its early losses triggered by a series of terrorist attacks at the airport and metro stations in Brussels. For once, the mining sector got out of the spotlight, with tourism and leisure shares being the most affected by the negative news. Also, shares in BT Group fell nearly 1% after telecoms regulator Ofcom told the company to install highspeed cables to businesses much faster and reduce the prices it charges for them. The daily chart shows little progress from previous updates, as the technical indicators continue to lack directional strength, although the index managed to close the day above its 20 and 100 SMAs. In the shorter term, the technical picture is still neutral, as the technical indicators keep hovering around their midlines, whilst the index is a handful of points above a horizontal 20 SMA.
Support levels: 6,112 6,075 6,037
Resistance levels: 6,239 6,268 6,326
The information set forth herein was obtained from sources which we believe to be reliable, but its accuracy cannot be guaranteed. It is not intended to be an offer, or the solicitation of any offer, to buy or sell the products or instruments referred herein. Any person placing reliance on this commentary to undertake trading does so entirely at their own risk.
Recommended Content
Editors’ Picks
USD/JPY holds near 155.50 after Tokyo CPI inflation eases more than expected

USD/JPY is trading tightly just below the 156.00 handle, hugging multi-year highs as the Yen continues to deflate. The pair is trading into 30-plus year highs, and bullish momentum is targeting all-time record bids beyond 160.00, a price level the pair hasn’t reached since 1990.
AUD/USD stands firm above 0.6500 with markets bracing for Aussie PPI, US inflation

The Aussie Dollar begins Friday’s Asian session on the right foot against the Greenback after posting gains of 0.33% on Thursday. The AUD/USD advance was sponsored by a United States report showing the economy is growing below estimates while inflation picked up.
Gold soars as US economic woes and inflation fears grip investors

Gold prices advanced modestly during Thursday’s North American session, gaining more than 0.5% following the release of crucial economic data from the United States. GDP figures for the first quarter of 2024 missed estimates, increasing speculation that the US Fed could lower borrowing costs.
Ethereum could remain inside key range as Consensys sues SEC over ETH security status

Ethereum appears to have returned to its consolidating move on Thursday, canceling rally expectations. This comes after Consensys filed a lawsuit against the US SEC and insider sources informing Reuters of the unlikelihood of a spot ETH ETF approval in May.
Bank of Japan expected to keep interest rates on hold after landmark hike

The Bank of Japan is set to leave its short-term rate target unchanged in the range between 0% and 0.1% on Friday, following the conclusion of its two-day monetary policy review meeting for April. The BoJ will announce its decision on Friday at around 3:00 GMT.
