EUR/USD
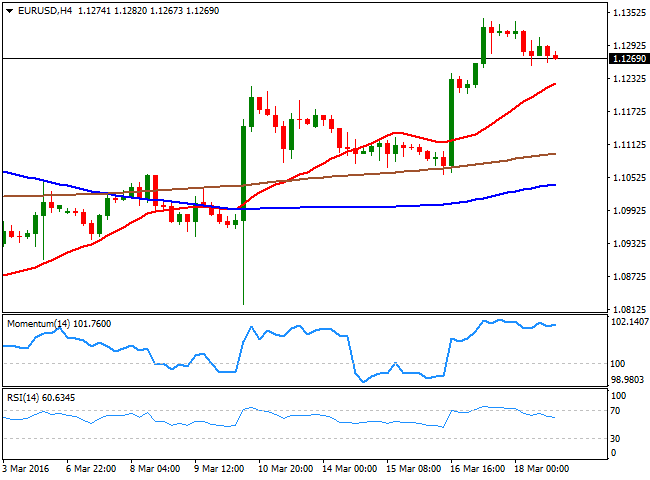
The EUR/USD pair closed with solid gains for third week inarow, but retreated on Friday mostly on profit taking. However, the latest FED's decision has sealed the future of the greenback, offering quite a negative outlook for further tightening of the economic policy, as FOMC members' median projection of rates was cut by about 50bp, leaving just two possible hikes for this year, pretty much taking out of the table any kind of announcement until September. Over the past two weeks, the imbalance between the FED and the ECB kept widening, which means that in the long run, the USD should outperform the common currency. But given the uncertainty surrounding the pace of rate hikes in the US and ECB's Praet comments on prospects for potential future easing later in the year, the pair may keep rallying for a bit longer before turning south. On Friday, news showed that the US University of Michigan confidence index fell in March to 90.0 from 91.7 in February versus expectations of a rise to 92.2, preventing the American currency from appreciating further. Both the current conditions and the expectations components dropped, which is a bit disappointing given the rebound in equities and the strength in the labour market. It could partially be down to the rise in gasoline prices from around $1.70/gallon as the midpoint for the national average for February versus $1.97/gallon as it stood yesterday (AAA data). It’s possible that politics may also be weighing on sentiment given the preponderance of negative soundbites. Nonetheless, we expect consumer spending to hold up given positive real wage growth and rising employment. Interestingly 1Y and 510Y inflation expectations rose to 2.7%, which is supportive of the Fed rate hike story.
Support levels: 1.1245 1.1200 1.1160
Resistance levels: 1.1310 1.1340 1.1375
GBP/USD
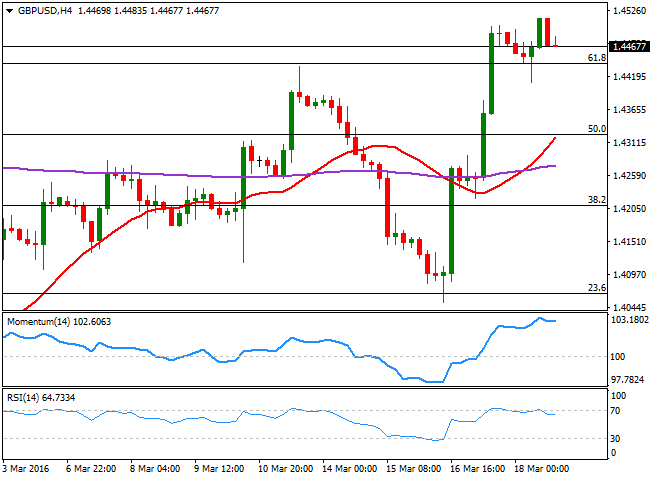
The Pound staged a brutal comeback against the greenback, after plummeting to 1.4052 on renewed fears of a possible Brexit. Mid week, the BOE maintained its economic policy unchanged, blaming partially a slowdown in economic growth to uncertainty surrounding Britain's referendum on its European Union membership. But the GBP/USD pair later surged as dollar got sold off after the FED, extending its weekly rally on Friday up to 1.4513, the highest in over a month. Having partially retreated, the pair holds above 1.4440, the 61.8% retracement of this year´s decline, suggesting the bullish run may not be over. Technically, the daily chart shows that the technical indicators have lost upward strength near overbought levels, but also that the price holds well above a bullish 20 DMA. The 100 DMA stands at 1.4565, and if the price manages to go through it, the rally can then complete a full 100% retracement to 1.4815, this year high. In the 4 hours chart, the technical indicators have corrected overbought readings, but show no downward strength, whilst the 20 SMA has turned sharply higher well below the current level, in line with the longer term tone.
Support levels: 1.4440 1.4405 1.4370
Resistance levels: 1.4520 1.4565 1.4600
USD/JPY
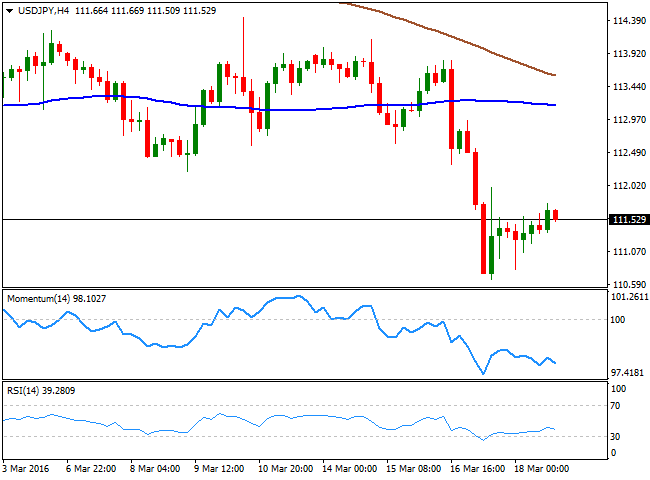
The USD/JPY came under strong selling pressure on FEDbased dollar's weakness, plummeting down to 110.66 after triggering stops below the 111.00 figure. Despite improved risk sentiment, the Japanese yen surged on the back of lower US yields as the 10Y Treasury yield has fallen for the most since January last week. The pair however, bounced strongly in what the market believes was some sort of BOJ induced intervention, by having called interbank dealers to "check exchange rates." The pair bounced up to 111.99 after the move, to settle around 111.50, unable to move far away from this last during Friday. Holding near the base of its previous range, the USD/JPY pair daily chart suggests further declines for the forthcoming sessions, as the technical indicators have broken their midlines and remain near oversold territory, having posted shallow bounces that are not enough to revert the downward pressure. In the 4 hours chart, the technical indicators have turned south within negative territory after correcting oversold readings, whilst the 200 SMA has accelerated its decline and approaches the 100 SMA, well above the current level, in line with the longer term perspective.
Support levels: 111.05 110.65 110.20
Resistance levels: 111.65 112.00 112.35
GOLD
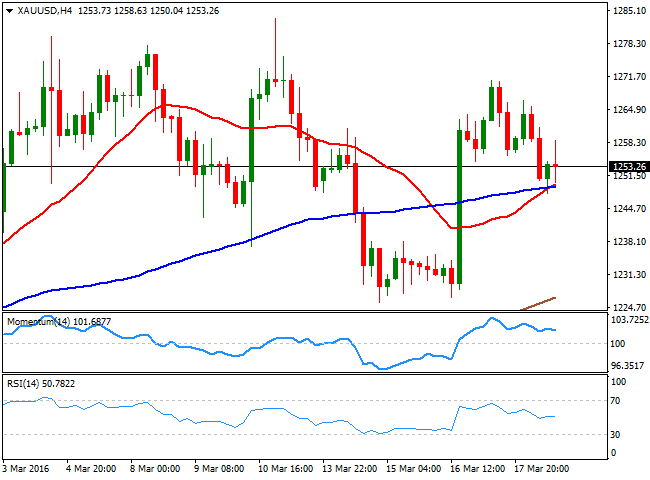
Spot gold closed the week flat around $1,253.25 a troy ounce, retreating on Friday on dollar's temporal strength. After falling to a 2week low at the beginning of the week, the bright metal recovered its shine following the US FED economic policy meeting on Wednesday, but was unable to extend the monthly high set at 1,283.50 early March. Anyway, sentiment towards the metal is positive, with investors looking for higher highs after the US Central Bank sounded far more dovish thanexpected. The daily chart shows a bearish divergence developing between price action and the Momentum indicator, this last aiming to break below its 100 level. The RSI indicator also heads lower within bullish territory, although the price held above the 20 SMA on Friday, currently around 1,248. In the 4 hours chart, the downward potential seems limited, given that the technical indicators have turned flat well above their midlines, whilst the price managed to bounce from a bullish 20 SMA, around 1,249.20. The line in the sand for the bullish trend stands at 1,225.00, as a break below this last can see the commodity confirming a steeper bearish corrective move, down to the 1,160/70 region.
Support levels: 1,249.20 1,240.90 1,233.15
Resistance levels: 1,265.40 1,275.70 1,283.50
WTI CRUDE
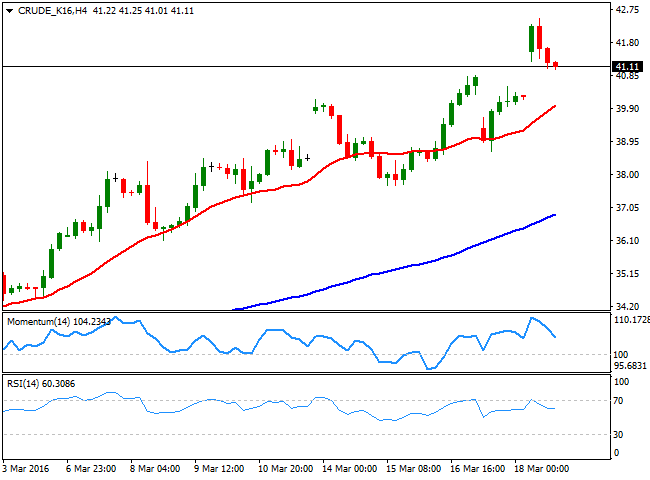
Crude oil prices continued rallying on Friday, with WTI futures topping at $42.48 a barrel on Friday, its highest for the year. Prices, however, retreated after the Baker Hughes report showed the first weekly rise in US oil rig count this year, up by 1, to 387. Little relevant as rigs drilling oil stand at record lows, speculators may have taken the news as a confirmation that the negative trend has reversed, and drilling will start to surge. Also, undermining prices was a broadly stronger greenback before the end of the week, in a profit taken driven move. Technically, US futures have stalled the recovery right around a bearish 200 DMA, having traded below it for over already a year. Nevertheless, and given that the price holds a few cents below it, and above a sharply bullish 20 SMA, the risk remains towards the upside. In the 4 hours chart, the price has extended further above a clearly bullish 20 SMA, although the technical indicators have turned south, holding so far, within bullish territory. As long as the price holds above the 40.00 level, buyers may remain on control, although a break below it can force some additional profit taking, and send the commodity down to 35.00 this week.
Support levels: 39.70 39.10 38.60
Resistance levels: 40.40 41.10 41.80
DAX
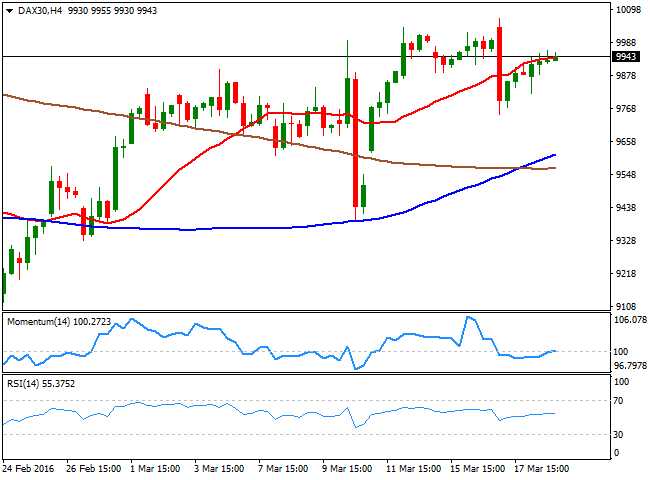
Stocks in Europe had a mixed day, with indexes closing mixed after bouncing back from a lower close on Thursday. The German benchmark, the DAX managed to add 58 points to close at 9,950.80, still unable to break above the critical 10,000 figure. On Friday, the fertilizer supplier K+S led with a 2.9% gain, followed by German utility RWE, up 2.8%. Semiconductor maker Infineon Technologies rose 2.3%, and German chemicals firm BASF closed 2.0% higher. The index managed to close the week with some limited gains, and the daily chart shows that the 20 SMA maintains a strong bullish slope below the current level, whilst the technical indicators have turned back north well into positive territory and following a limited downward corrective, still favoring the upside. The 100 DMA stands at 10,168 and some follow through beyond the level is required to open doors for a continued rally. In the short term, the 4 hours chart shows that the index struggles around a bullish 20 SMA, while the technical indicators have turned slightly higher around their midlines, lacking directional strength at the time being.
Support levels: 9.891 9,839 9,773
Resistance levels: 10,010 10,069 10,118
DOW JONES
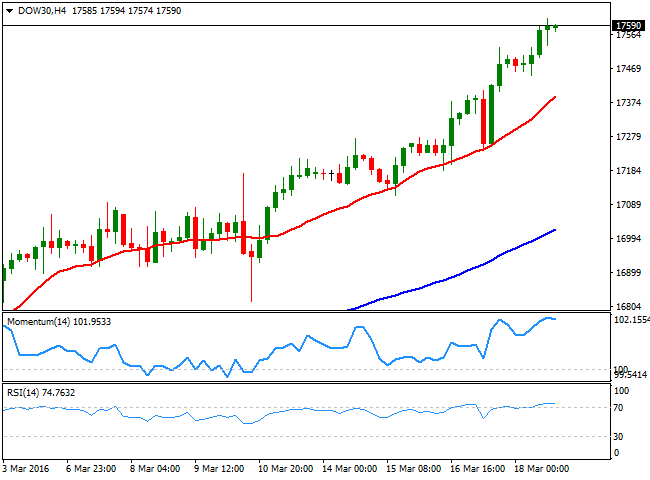
Wall Street edged higher for the fifth straight week, with the DJIA and the SandP closing at their highest levels so far this year. The Dow ended at 17,602.30, up by 120 points, the Nasdaq surged 0.43% to end at 4,795.65, while the SandP added 9 points to end at 2,049.58, extending their post FED rally, triggered by hopes rates will remain low for longer than initially believed. The financial sector lead the way higher, but the energy related one under performed, on the back of oil's slide. The index daily chart shows that the upward momentum continues, given that the technical indicators continue heading north, despite being in overbought territory, whist the 20 SMA has accelerated its advance and crossed above the 100 and 200 DMAs for the first time this year. The overbought conditions may be due to a correction, but the dominant bullish tone will likely prevail. Shorter term, and according to the 4 hours chart, the upward bias is also favored, given that the technical indicators consolidate in overbought territory, far from suggesting a downward upcoming move, while the index had extended further beyond its moving averages, which maintain sharp bullish slopes.
Support levels: 17,533 17,449 17,371
Resistance levels: 17,610 17,665 17,728
FTSE 100
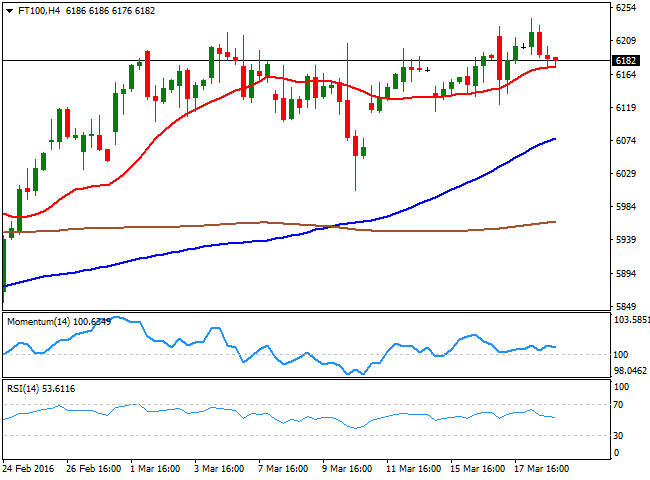
The FTSE 100 lost 11 points or 0.19% to close at 6,189.64 last Friday, up on the week, but 0.80%. The mining related sector ended mixed, due to a decline in oil's prices and the lack of momentum in metals. Glencore managed to advance, up 1.8%, but Randgold Resources lost 2.18%. The London benchmark briefly advanced beyond the 6,200 level, posting an intraday high of 6,239 its highest for the year. The daily chart for the index shows that while it is still above a bullish 20 DMA, but contained by a bearish 200 DMA at 6,271. In the same chart, the technical indicators have turned flat above their midlines, with no directional strength. In the 4 hours chart, the technical picture is neutral, as the index stands above a horizontal 20 SMA, whole the technical indicators rest around their midlines. A steady advance beyond the mentioned 200 DMA is required to draw a more constructive scenario with the market then pointing to test the 6,500 region.
Support levels: 6,112 6,075 6,037
Resistance levels: 6,239 6,271 6,326
The information set forth herein was obtained from sources which we believe to be reliable, but its accuracy cannot be guaranteed. It is not intended to be an offer, or the solicitation of any offer, to buy or sell the products or instruments referred herein. Any person placing reliance on this commentary to undertake trading does so entirely at their own risk.
Recommended Content
Editors’ Picks
USD/JPY holds near 155.50 after Tokyo CPI inflation eases more than expected

USD/JPY is trading tightly just below the 156.00 handle, hugging multi-year highs as the Yen continues to deflate. The pair is trading into 30-plus year highs, and bullish momentum is targeting all-time record bids beyond 160.00, a price level the pair hasn’t reached since 1990.
AUD/USD stands firm above 0.6500 with markets bracing for Aussie PPI, US inflation

The Aussie Dollar begins Friday’s Asian session on the right foot against the Greenback after posting gains of 0.33% on Thursday. The AUD/USD advance was sponsored by a United States report showing the economy is growing below estimates while inflation picked up.
Gold soars as US economic woes and inflation fears grip investors

Gold prices advanced modestly during Thursday’s North American session, gaining more than 0.5% following the release of crucial economic data from the United States. GDP figures for the first quarter of 2024 missed estimates, increasing speculation that the US Fed could lower borrowing costs.
Ethereum could remain inside key range as Consensys sues SEC over ETH security status

Ethereum appears to have returned to its consolidating move on Thursday, canceling rally expectations. This comes after Consensys filed a lawsuit against the US SEC and insider sources informing Reuters of the unlikelihood of a spot ETH ETF approval in May.
Bank of Japan expected to keep interest rates on hold after landmark hike

The Bank of Japan is set to leave its short-term rate target unchanged in the range between 0% and 0.1% on Friday, following the conclusion of its two-day monetary policy review meeting for April. The BoJ will announce its decision on Friday at around 3:00 GMT.
