EUR/USD Current Price: 1.1420
View Live Chart for the EUR/USD
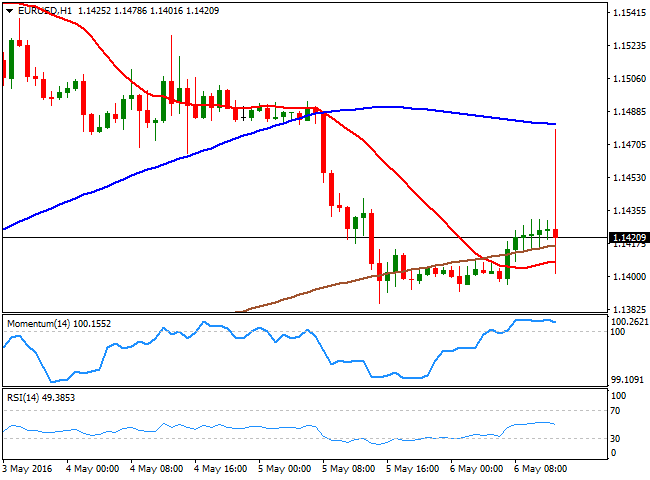
The American dollar traded marginally lower during Asian and European hours, but remained mostly range bound ahead of the US Nonfarm Payroll report, when it jumped lower, following news that the US added just 160,000 new jobs in April, against the 200,000 expected. The unemployment rate held steady at 5.0% during the same month, whilst wages matched expectations monthly basis, up by 0.3% and resulted at 2.5% yearly basis, slightly better-than-expected.
The EUR/USD pair spiked up to 1.4786, but then retreated towards 1.1401,trading flat on mixed data that is not enough to set a clear directional tone. In the 1 hour chart, the technical indicators have turned flat within positive territory, whilst the price holds above its 20 SMA. The 100 SMA in the mentioned time frame, stands at 1.1480, the level to overcome to see the common currency rallying further. In the 4 hours chart, the price remains below a bearish 20 SMA while the technical indicators stand below their mid-lines, lacking enough upward strength to confirm additional rallies for today.
Support levels: 1.1380 1.1335 1.1290
Resistance levels: 1.1480 1.1530 1.1570
GBP/USD Current price: 1.4446
View Live Chart for the GBP/USD
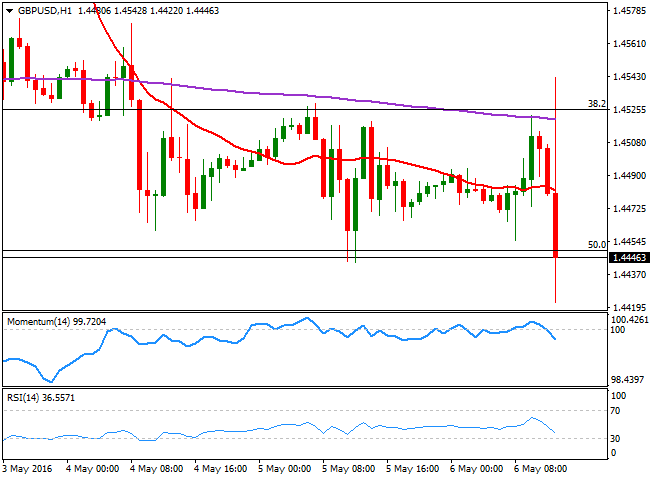
The GBP/USD pair rallied up to 1.4542 with the release of US data, but quickly retreated towards its pre-report levels, now aiming to extend its decline. The pair was unable to hold gains above the 38.2% retracement of the latest bullish run and plummeted to a fresh weekly low of 1.4420, now trading also below the 50% retracement of the same rally. In the 1 hour chart, the technical stance is clearly bearish, with the price below a mild bearish 20 SMA and the technical indicators heading sharply lower below their mid-lines. In the 4 hours chart, the technical indicators have also turned south within negative territory, while the 20 SMA maintains its bearish slope above the current level, supporting some additional declines on a break below 1.4410.
Support levels: 1.4410 1.4370 1.4330
Resistance levels: 1.4485 1.4520 1.4560
USD/JPY Current price: 106.53
View Live Chart for the USD/JPY
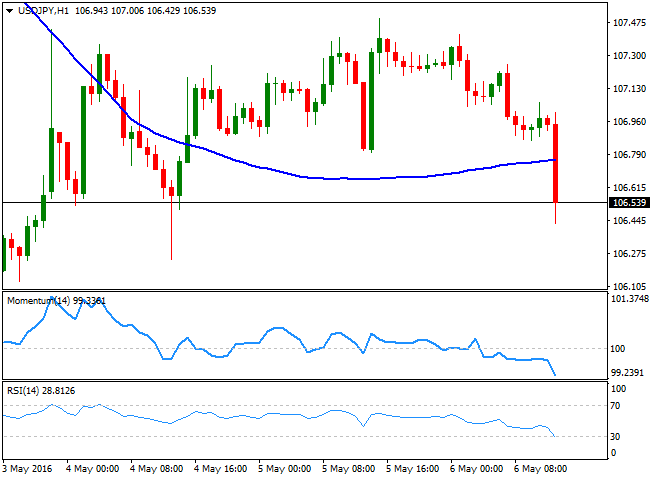
Resuming its bearish trend. The USD/JPY pair fell below the 106.60 level after the release of a mixed US employment report, showing less-than-expected jobs added, but an uptick in wages. Stocks plummeted with the news, which means the risk is of further declines in the pair ahead of the weekly close, and in spite of dollar's advance against its European rivals. The 1 hour chart shows that the price is now below a horizontal 20 SMA, while the technical indicators have turned south within negative territory, supporting an extension of the ongoing decline. In the 4 hours chart, indicators also head south below their mid-lines, in line with further slides, particularly on a break below 106.00, with scope then to test the 105.55 multi-year low posted earlier this month.
Support levels: 106.00 105.55 105.20
Resistance levels: 107.00 107.45 107.90
Information on these pages contains forward-looking statements that involve risks and uncertainties. Markets and instruments profiled on this page are for informational purposes only and should not in any way come across as a recommendation to buy or sell in these assets. You should do your own thorough research before making any investment decisions. FXStreet does not in any way guarantee that this information is free from mistakes, errors, or material misstatements. It also does not guarantee that this information is of a timely nature. Investing in Open Markets involves a great deal of risk, including the loss of all or a portion of your investment, as well as emotional distress. All risks, losses and costs associated with investing, including total loss of principal, are your responsibility. The views and opinions expressed in this article are those of the authors and do not necessarily reflect the official policy or position of FXStreet nor its advertisers. The author will not be held responsible for information that is found at the end of links posted on this page.
If not otherwise explicitly mentioned in the body of the article, at the time of writing, the author has no position in any stock mentioned in this article and no business relationship with any company mentioned. The author has not received compensation for writing this article, other than from FXStreet.
FXStreet and the author do not provide personalized recommendations. The author makes no representations as to the accuracy, completeness, or suitability of this information. FXStreet and the author will not be liable for any errors, omissions or any losses, injuries or damages arising from this information and its display or use. Errors and omissions excepted.
The author and FXStreet are not registered investment advisors and nothing in this article is intended to be investment advice.
Recommended Content
Editors’ Picks
EUR/USD holds below 1.0750 ahead of key US data

EUR/USD trades in a tight range below 1.0750 in the European session on Friday. The US Dollar struggles to gather strength ahead of key PCE Price Index data, the Fed's preferred gauge of inflation, and helps the pair hold its ground.
USD/JPY stays firm above 156.00 after BoJ Governor Ueda's comments

USD/JPY stays firm above 156.00 after surging above this level on the Bank of Japan's decision to leave the policy settings unchanged. BoJ Governor said weak Yen was not impacting prices but added that they will watch FX developments closely.
Gold price oscillates in a range as the focus remains glued to the US PCE Price Index

Gold price struggles to attract any meaningful buyers amid the emergence of fresh USD buying. Bets that the Fed will keep rates higher for longer amid sticky inflation help revive the USD demand.
Bitcoin Weekly Forecast: BTC’s next breakout could propel it to $80,000 Premium

Bitcoin’s recent price consolidation could be nearing its end as technical indicators and on-chain metrics suggest a potential upward breakout. However, this move would not be straightforward and could punish impatient investors.
US core PCE inflation set to signal firm price pressures as markets delay Federal Reserve rate cut bets

The core PCE Price Index, which excludes volatile food and energy prices, is seen as the more influential measure of inflation in terms of Fed positioning. The index is forecast to rise 0.3% on a monthly basis in March, matching February’s increase.