EUR/USD Current Price: 1.1282
View Live Chart for the EUR/USD
The common currency corrected lower by the end of the last week, but the dollar retained the negative bias against all of its major rivals, with commodity currencies outperforming. Chinese latest data was overall positive with industrial production rising the most in almost a year. Industrial output rose 6.8% in March compared to a year earlier, while retail sales also beat market´s expectations, printing at 10.5%y/y in March versus 10.4% median forecast. Finally, China’s GDP for the first quarter printed at 6.7%y/y, matching forecast, but down from 6.8% in the December quarter.
On Friday, poor US data put a halt to dollar's advance, as it happened several times over these last few days. US industrial production fell 0.6% in March, compared to February, whilst the University of Michigan index of consumer sentiment for April fell to 89.7 compared to an expected 91.9.
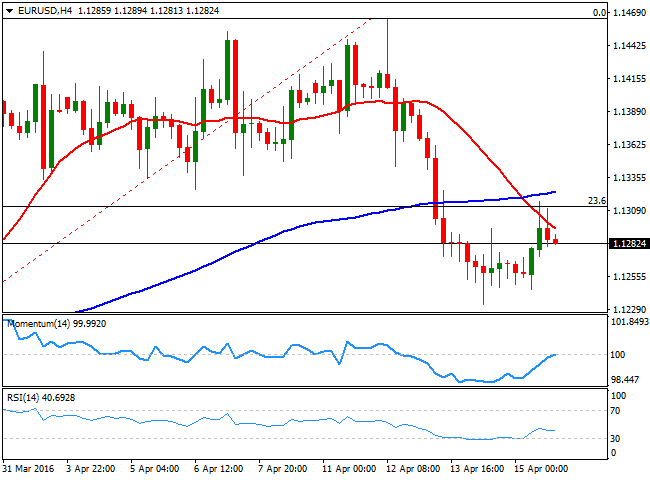
The EUR/USD par closed the week at 1.1282 after failing to surpass a major static resistance level, the 1.4160 region, tested at the beginning of the week. On Friday, the price was contained by 1.1315, the 23.6% retracement of the latest daily bullish run between 1.0821, March 3rd low, and the high posted at 1.1461 this April. The weekly decline stalled short from the 38.2% retracement of the same rally, at 1.1220, the level to break to confirm a steeper decline this week. In the meantime, the daily chart presents a limited bearish tone, as the price stands below a bullish 20 SMA whilst the technical indicators have crossed their mid-lines towards the downside, but lost bearish strength within neutral territory, indicating limited scope for additional declines. In the shorter term, the 4 hours chart maintains a negative tone, as the price remains capped by a bearish 20 SMA whilst the technical indicators have lost upward steam after bouncing from their mid-lines, and the RSI already turned south, increasing the risk of a new leg south.
Support levels: 1.1235 1.1200 1.1160
Resistance levels: 1.13001.1335 1.1380
EUR/JPY Current price: 122.65
View Live Chart for the EUR/JPY
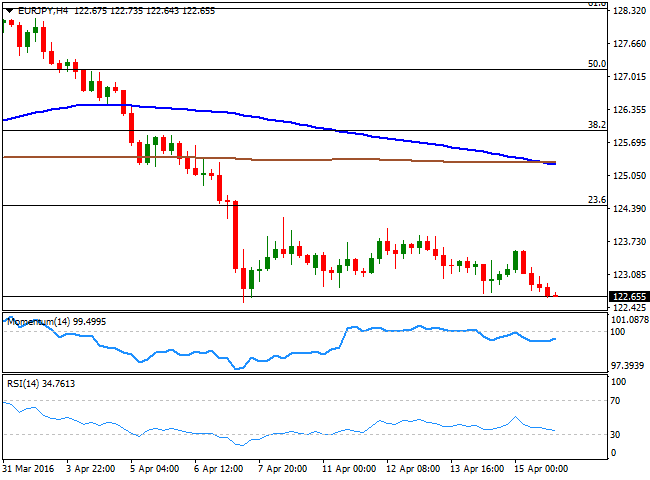
The EUR/JPY pair closed the week at its lowest, as a weaker euro added to a strong yen. The Japanese currency retreated partially from the highs posted against the greenback at 107.62, but tepid US data released on Thursday and Friday put the JPY back in the bullish track. The EUR/JPY pair trades near the year low, posted in February at 122.02, an almost three-year low, and the daily chart shows that the technical indicators head sharply lower near oversold territory whilst the 100 DMA accelerated its decline far above the current level, indicating the bearish momentum remains strong. In the 4 hours chart, the technical indicators remain flat within negative territory, whilst the 100 SMA is crossing below the 200 SMA in the 125.2 region, too far away to be relevant as resistance, but also supporting a bearish bias for the upcoming days.
Support levels: 122.50 122.00 121.60
Resistance levels: 122.90 123.35 123.60
GBP/USD Current price: 1.4197
View Live Chart for the GBP/USD
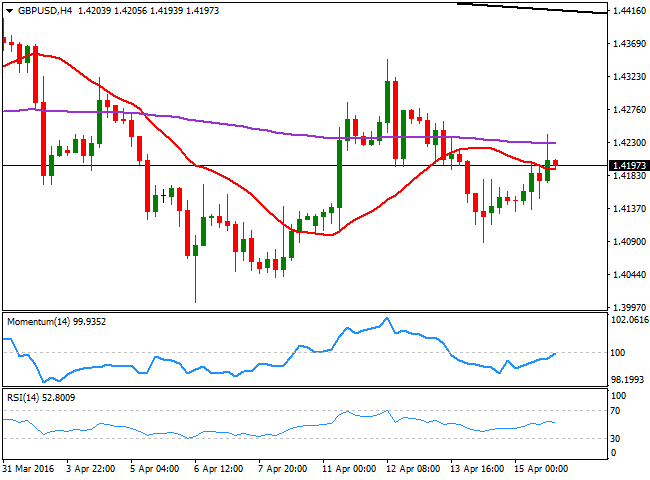
The GBP/USD pair has managed to end the week with some limited gains, but below the 1.4200 after faltering again to sustain gains beyond the 1.4300 figure. The Pound continues being weighed by uncertainty over a possible Brexit, and the underlying risks of leaving the EU. The referendum over a Brexit will take place by the ends of June, and as commented on previous updates, the Sterling will likely remain unattractive until then. In the meantime, the technical stance favors a continued decline, although limited, with buying interest aligned in the 1.4000/50 region. In the daily chart, the pair closed the week around a horizontal 20 SMA, whilst the technical indicators turned slightly higher within negative territory, rather favoring some consolidation than further declines. In the 4 hours chart, the price is around its 20 SMA, but below the 200 EMA, whilst the technical indicators advanced towards their mid-lines, but remain within negative territory, leaving little room for additional advances.
Support levels: 1.4160 1.4130 1.4090
Resistance levels: 1.4240 1.4285 1.4330
USD/JPY Current price: 108.70
View Live Chart for the USD/JPY
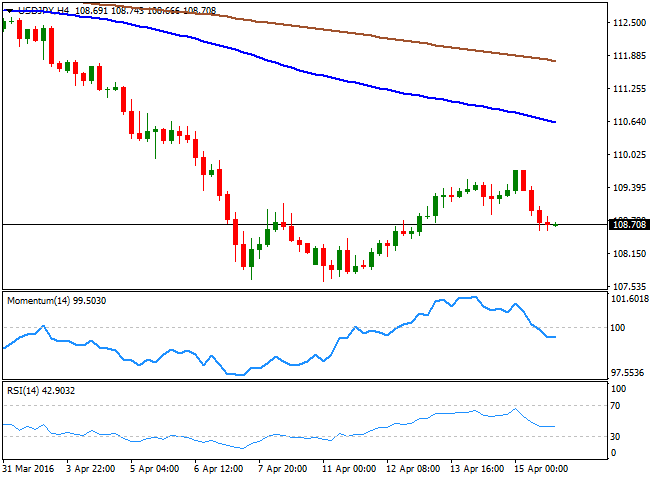
The USD/JPY pair bounced from the multi-month low posted at 107.62, but the weekly recovery stalled below the 110.00 figure, and the pair resumed its decline by the end of the week as US data disappointed, with poor retail sales, industrial production, and sentiment indexes missing market's expectations and generally below previous months' readings. The up-turn seen mid last week was enough to help the pair correcting extreme oversold readings reached in the daily chart, but have then resumed their declines deep into negative territory, and speculative interest will be now looking for a move below the mentioned 107.60 region, targeting first the 106.20 price zone, and 105.00 then, where the Bank of Japan established its latest line in the sand for Yen's strength. Shorter term, the pair retains the negative tone, with the technical indicators consolidating within bearish territory, and the price developing well below its moving averages.
Support levels: 108.40 107.95 107.60
Resistance levels: 109.20 109.50 110.00
AUD/USD Current price: 0.7714
View Live Chart for the AUD/USD
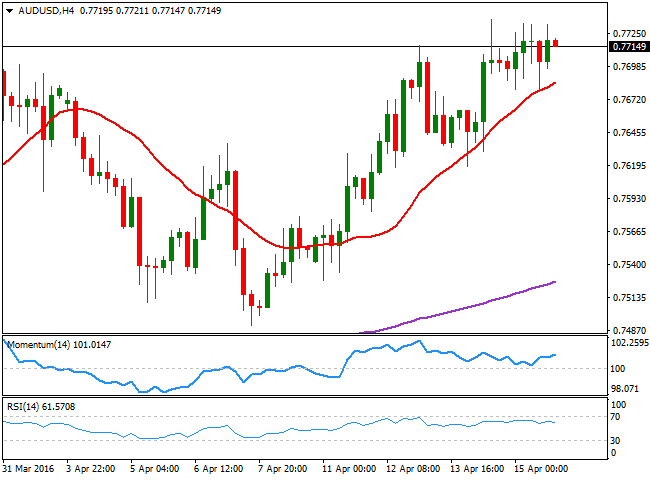
The AUD/USD pair posted its highest weekly close since June 2015, establishing above the 0.7700 after posting a fresh year high of 0.7736. The Aussie was boosted by positive Chinese data released all through the week, suggesting the world's second biggest economy has pared its economic slowdown. Commodity-related currencies, also found support in a sharp recovery in oil prices, although the black gold retreated on Friday, hit by profit taking ahead of the Doha meeting undergoing in Qatar. Still unable to clearly break above 0.7720, in where the price stalled several times over the last two months, the overall outlook is still bullish, although the pair may suffer a setback at the weekly opening, if worldwide oil producers failed to reach an agreement on an output freeze. From a technical point of view, the daily chart shows that the price is well above its 20 SMA, whilst the RSI indicator aims higher around 62. The Momentum indicator, however, diverges lower, and approaches its mid-line within positive territory. In the 4 hours chart, however, the upward potential is firmer, as approaches to a sharply bullish 20 SMA have attracted buying interest ever since the week started, whilst the Momentum indicator heads north and the RSI consolidates around 61, all of which favors additional advances, particularly on a break above 0.7735, the immediate resistance.
Support levels: 0.7690 0.7650 0.7610
Resistance levels: 0.7735 0.7760 0.7800
Information on these pages contains forward-looking statements that involve risks and uncertainties. Markets and instruments profiled on this page are for informational purposes only and should not in any way come across as a recommendation to buy or sell in these assets. You should do your own thorough research before making any investment decisions. FXStreet does not in any way guarantee that this information is free from mistakes, errors, or material misstatements. It also does not guarantee that this information is of a timely nature. Investing in Open Markets involves a great deal of risk, including the loss of all or a portion of your investment, as well as emotional distress. All risks, losses and costs associated with investing, including total loss of principal, are your responsibility. The views and opinions expressed in this article are those of the authors and do not necessarily reflect the official policy or position of FXStreet nor its advertisers. The author will not be held responsible for information that is found at the end of links posted on this page.
If not otherwise explicitly mentioned in the body of the article, at the time of writing, the author has no position in any stock mentioned in this article and no business relationship with any company mentioned. The author has not received compensation for writing this article, other than from FXStreet.
FXStreet and the author do not provide personalized recommendations. The author makes no representations as to the accuracy, completeness, or suitability of this information. FXStreet and the author will not be liable for any errors, omissions or any losses, injuries or damages arising from this information and its display or use. Errors and omissions excepted.
The author and FXStreet are not registered investment advisors and nothing in this article is intended to be investment advice.
Recommended Content
Editors’ Picks
EUR/USD alternates gains with losses near 1.0720 post-US PCE

The bullish tone in the Greenback motivates EUR/USD to maintain its daily range in the low 1.070s in the wake of firmer-than-estimated US inflation data measured by the PCE.
GBP/USD clings to gains just above 1.2500 on US PCE

GBP/USD keeps its uptrend unchanged and navigates the area beyond 1.2500 the figure amidst slight gains in the US Dollar following the release of US inflation tracked by the PCE.
Gold keeps its daily gains near $2,350 following US inflation

Gold prices maintain their constructive bias around $2,350 after US inflation data gauged by the PCE surpassed consensus in March and US yields trade with slight losses following recent peaks.
Bitcoin Weekly Forecast: BTC’s next breakout could propel it to $80,000 Premium

Bitcoin’s recent price consolidation could be nearing its end as technical indicators and on-chain metrics suggest a potential upward breakout. However, this move would not be straightforward and could punish impatient investors.
Week ahead – Hawkish risk as Fed and NFP on tap, Eurozone data eyed too

Fed meets on Wednesday as US inflation stays elevated. Will Friday’s jobs report bring relief or more angst for the markets? Eurozone flash GDP and CPI numbers in focus for the Euro.