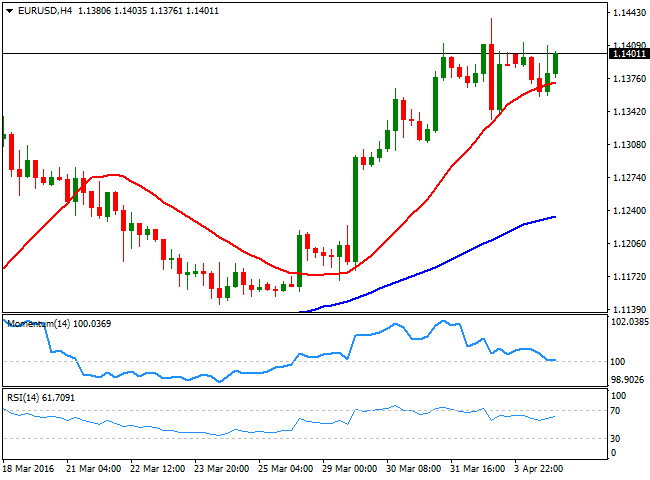
EUR/USD Current Price: 1.1401
View Live Chart for the EUR/USD
Majors held within limited ranges this Monday, but the American dollar retained the negative tone, ending the day down against most of its major rivals, although commodity-related currencies were under pressure amid another negative day for oil.
The EUR/USD pair managed to advance up to 1.1412 daily basis, but spent most of the American afternoon hovering around the 1.1400 level, unable to set to a clear directional bias. Data came in mixed, as in Europe, the unemployment rate declined to 10.3% in February from an upwards revised 10.4% in January, but producer prices fell by 0.7% in February, compared to the previous month, and down by 4.2% compared to a year before, indicating deflationary pressures are still high. In the US, new orders for factory goods declined 1.7%, more than the 1.6% decline expected. This week, the FED will release the minutes of its latest meeting on Wednesday, while the ECB will do the same on Thursday, something that may lead to further range trading, but with a dollar still in risk of further declines.
From a technical point of view, and despite the poor intraday performance, the EUR/USD pair remains near its yearly high of 1.1437, while daily basis, the pair has posted a lower low, indicating market is still willing to buy the dips. Technical readings in the 1 hour chart support some further advances, as the technical indicators continue heading north after crossing their mid-lines, while the price is currently above a flat 20 SMA. In the 4 hours chart, a brief decline below a bullish 20 SMA was quickly reverted, while the Momentum indicator has turned flat around its 100 level after correcting overbought readings, and the RSI indicator heads north around 61, all of which points for further gains towards the 1.1460 critical resistance, en route to 1.1500.
Support levels: 1.1360 1.1320 1.1280
Resistance levels: 1.1420 1.1460 1.1500
EUR/JPY Current price: 126.75
View Live Chart for the EUR/JPY
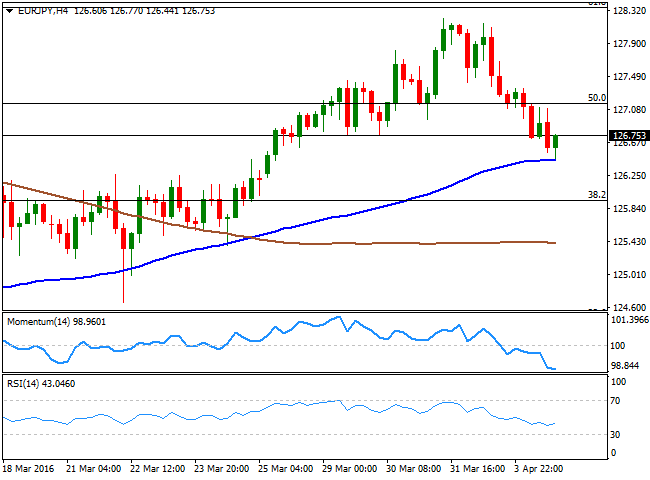
The poor performance of stocks alongside with commodities' weakness, resulted in an increased demand for the Japanese yen at the beginning of the week. The safe haven asset gained against a mute EUR, and the EUR/JPY extended its decline down to 126.44, ending the day a handful of pips above this last, but retaining the bearish tone in the short term. Technically, the 1 hour chart shows that the price has extended below the 200 SMA early US session, while the technical indicators have turned back south within bearish territory, and after correcting oversold conditions. In the 4 hours chart, the technical indicators have lost their bearish strength, but remain below their mid-lines, and with no signs of turning south. The pair found some buying interest around the 100 SMA in this last time frame around the mentioned low, suggesting a break below it required to confirm additional declines for this Tuesday.
Support levels: 126.45 126.10 125.70
Resistance levels: 127.05 127.45 127.90
GBP/USD Current price: 1.4282
View Live Chart for the GBP/USD
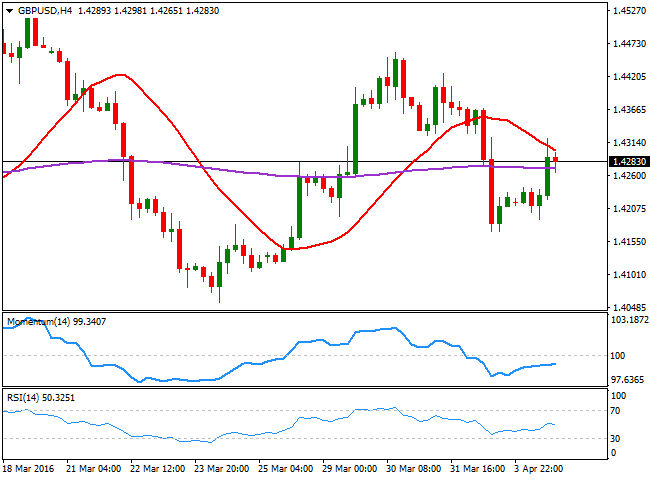
The GBP/USD pair rose early Europe, with no clear catalyst behind the move, as the only piece of data release in the UK was the construction PMI for March, which resulted at 54.2, unchanged from February. The pair however, recovered up to 1.4321, from where it slowly retreated in a quiet US session, back below the 1.4300 figure. The kingdom will release its latest Services PMI on Tuesday, expected at 53.9 from a previous 52.7. The services sector has been showing steady growth ever since the year started, unlikely to other sectors of the economy, so a positive reading should not come as a surprise. Nevertheless, a better-than-expected number may help the Pound to recover further, as it has been lately underperforming. Short term, technical readings in the 1 hour chart hold in positive ground, but lack directional momentum, anticipating some further range ahead. In the 4 hours chart, the price was capped by a strongly bearish 20 SMA, currently around 1.4315, whilst the technical indicators remain within negative territory. Overall, there's no technical confirmation that the pair may keep rallying during the upcoming hours, and it will take some follow through above the mentioned high to confirm additional gains, while it will take a clear acceleration below 1.4260 to see the pair resuming its bearish trend.
Support levels: 1.4260 1.4210 1.4170
Resistance levels: 1.4315 1.4360 1.4410
USD/JPY Current price: 111.13
View Live Chart for the USD/JPY
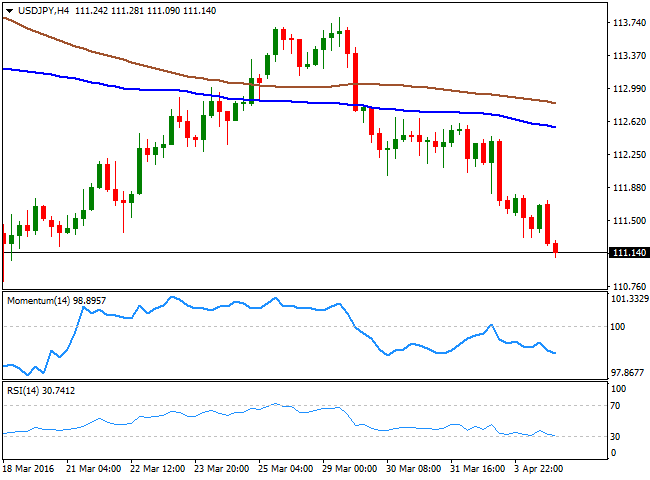
The Japanese yen kept rallying against the greenback, leaving the USD/JPY pair near the critical 111.00 level ahead of the Asian opening, and with the focus still on the downside. The JPY appreciated as stocks struggled for direction this Monday, while US Treasury yields edged lower, with the 10y benchmark down 1.28% to 1.77%. Earlier in the day, Japanese PM Shinzo Abe said the government will give details of its plan to front-load the 2016 fiscal budget at the cabinet meeting this Tuesday, which may result if a downward move of the local currency, should the budget include additional easing, although the movement could be short-lived. In the meantime, the short term picture is clearly bearish, given that in the 1 hour chart, the price pressures its lows and stands below its 100 and 200 SMAs, with the shortest now around 112.10, whilst the technical indicators head lower within negative territory. In the 4 hours chart, the technical indicators present a strong bearish momentum, with the RSI indicator approaching oversold levels, and the price well below its 100 and 200 SMAs, all of which supports a continued decline down to the 110.00 figure.
Support levels: 111.00 110.65 110.30
Resistance levels: 111.60 112.10 112.60
AUD/USD Current price: 0.7608
View Live Chart for the AUD/USD
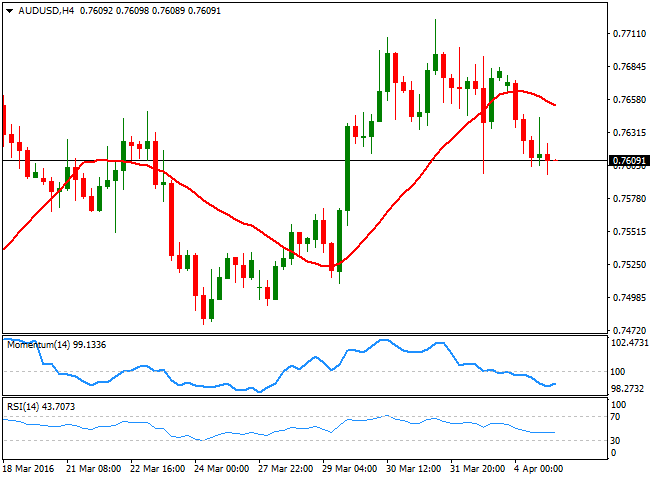
The Aussie fell down to 0.7597 against the greenback, and hold around the 0.7600 figure by the end of the day, hit at the beginning of the week by a downward surprise in inflation. Australian March monthly inflation gauge was flat, while compared to a year before, it advanced 1.7% against previous 2.1%. Also, weighing on the antipodean currencies were weaker commodities' prices, as both gold and oil, ended the day lower. During the upcoming Asian session, the RBA will announce its latest economic policy decision, in where the Central Bank is largely expected to maintain rates on-hold, and offer a mild hawkish tone, which should send the pair higher afterwards. But the country will also release its February trade balance data, which will probably make some noise, particularly on a disappointing result. Technically, the short term bias is bearish, given that in the 1 hour chart, the price is developing below a bearish 20 SMA, whilst the technical indicators have turned south within negative territory. In the 4 hours chart, the Momentum indicator heads sharply lower as the 20 SMA turns south above the current level, and the RSI indicator stands at 43, all of which supports a downward continuation, particularly on a break below 0.7570, the immediate support.
Support levels: 0.7570 0.7540 0.7500
Resistance levels: 0.7620 0.7660 0.7700
Information on these pages contains forward-looking statements that involve risks and uncertainties. Markets and instruments profiled on this page are for informational purposes only and should not in any way come across as a recommendation to buy or sell in these assets. You should do your own thorough research before making any investment decisions. FXStreet does not in any way guarantee that this information is free from mistakes, errors, or material misstatements. It also does not guarantee that this information is of a timely nature. Investing in Open Markets involves a great deal of risk, including the loss of all or a portion of your investment, as well as emotional distress. All risks, losses and costs associated with investing, including total loss of principal, are your responsibility. The views and opinions expressed in this article are those of the authors and do not necessarily reflect the official policy or position of FXStreet nor its advertisers. The author will not be held responsible for information that is found at the end of links posted on this page.
If not otherwise explicitly mentioned in the body of the article, at the time of writing, the author has no position in any stock mentioned in this article and no business relationship with any company mentioned. The author has not received compensation for writing this article, other than from FXStreet.
FXStreet and the author do not provide personalized recommendations. The author makes no representations as to the accuracy, completeness, or suitability of this information. FXStreet and the author will not be liable for any errors, omissions or any losses, injuries or damages arising from this information and its display or use. Errors and omissions excepted.
The author and FXStreet are not registered investment advisors and nothing in this article is intended to be investment advice.
Recommended Content
Editors’ Picks
EUR/USD edges lower toward 1.0700 post-US PCE

EUR/USD stays under modest bearish pressure but manages to hold above 1.0700 in the American session on Friday. The US Dollar (USD) gathers strength against its rivals after the stronger-than-forecast PCE inflation data, not allowing the pair to gain traction.
GBP/USD retreats to 1.2500 on renewed USD strength

GBP/USD lost its traction and turned negative on the day near 1.2500. Following the stronger-than-expected PCE inflation readings from the US, the USD stays resilient and makes it difficult for the pair to gather recovery momentum.
Gold struggles to hold above $2,350 following US inflation

Gold turned south and declined toward $2,340, erasing a large portion of its daily gains, as the USD benefited from PCE inflation data. The benchmark 10-year US yield, however, stays in negative territory and helps XAU/USD limit its losses.
Bitcoin Weekly Forecast: BTC’s next breakout could propel it to $80,000 Premium

Bitcoin’s recent price consolidation could be nearing its end as technical indicators and on-chain metrics suggest a potential upward breakout. However, this move would not be straightforward and could punish impatient investors.
Week ahead – Hawkish risk as Fed and NFP on tap, Eurozone data eyed too

Fed meets on Wednesday as US inflation stays elevated. Will Friday’s jobs report bring relief or more angst for the markets? Eurozone flash GDP and CPI numbers in focus for the Euro.