EUR/USD Current price: 1.1245
View Live Chart for the EUR/USD
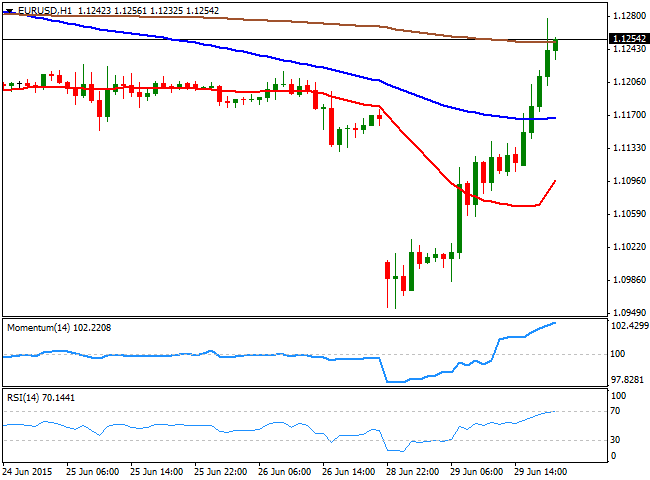
The EUR/USD pair staged a massive comeback this Monday, surging up to 1.1276 intraday, after trading as low as 1.0954 during the early Asian hours. The recovery of the common currency began during European hours, as the SNB was active in the markets, with governor Jordan explicitly saying that they were intervening to prevent CHF strength. But the rally extended beyond the wildest estimation during the American afternoon, with no actual catalyst beyond it, and despite Greece will not pay the €1.6 billion due to the IMF on Tuesday, entering in default. Also, hopes that a deal is still possible are supporting some EUR demand after Dijsselbloem said that the door for negotiations is still open. Junker addressed directly to the people of Greece, asking them to vote "yes" and therefore, vote for the EUR.
The short term technical picture shows that the price holds at an almost one week high, with the 1 hour chart showing that the technical indicators are beginning to look exhausted in extreme overbought levels, whilst the rally stalled around its 200 SMA. In the 4 hours chart the bias is higher, as the technical indicators maintain their bullish slopes after crossing their mid-lines towards the upside, while the 20 SMA is turning higher around the 1.1160 region. Renewed buying interest beyond 1.1290, should lead to an upward continuation towards the 1.1400 level this Tuesday.
Support levels: 1.1234 1.1200 1.1160
Resistance levels: 1.1290 1.1340 1.1380
EUR/JPY Current price: 137.84
View Live Chart for the EUR/JPY
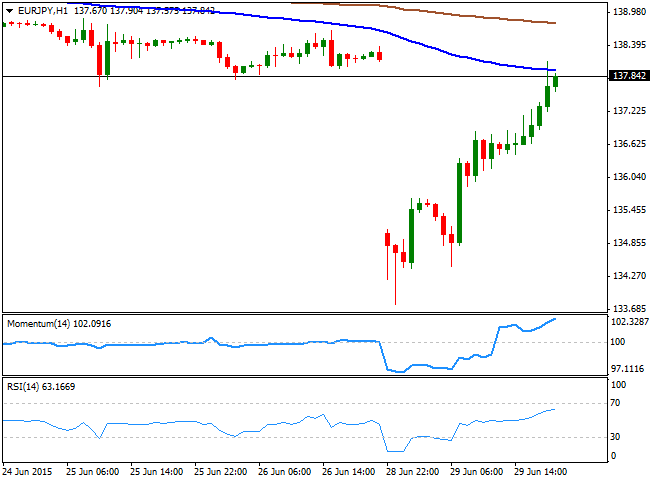
The EUR/JPY has recovered all of the ground lost, filling the almost 300 pips gaps of its weekly opening, in the American afternoon. Despite the Japanese yen traded generally higher against most of its rivals, EUR demand imposed itself in the cross. The pair surged to an intraday high of 138.13, where the hourly chart shows the 100 SMA capping the upside. The 200 SMA in the same chart stands around 138.80, whilst the technical indicators are barely decelerating near overbought territory. In the 4 hours chart, the technical indicators are heading higher, but still in negative territory, extending their recovery from extreme oversold territory. The immediate resistance comes at 138.20, with a recovery above it probably maintaining the bid tone in the pair for the rest of the day.
Support levels: 137.50 136.90 136.40
Resistance levels: 138.20 138.80 139.40
GBP/USD Current price: 1.5732
View Live Chart for the GBP/USD
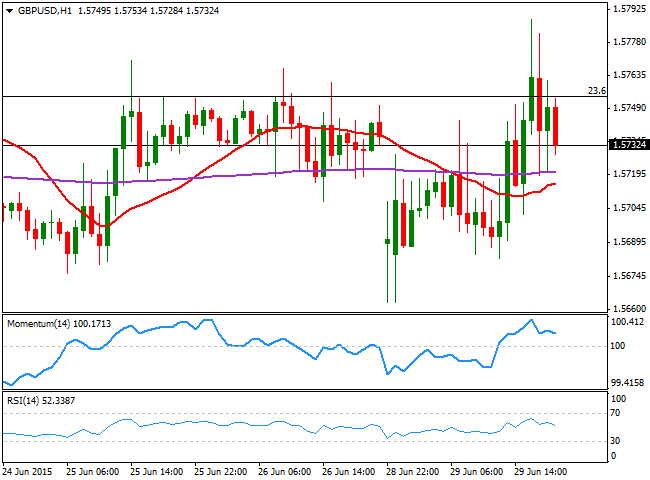
The GBP/USD pair has posted a limited advance intraday up to 1.5788, failing, however, to sustain gains above the 1.5750 price zone, a strong Fibonacci level that has attracted selling interest for most of the last week. Earlier in the day, the UK released its mortgage approvals figures for May that unexpectedly fell from the 14-month high posted last April. The decline was attributed to higher prices as a result of a continuing shortage of properties for sale. The news weighed on the Pound earlier in the day, but the GBP/USD held within a familiar range for most of the day, trading between Fibonacci levels. Technically, the 1 hour chart shows that the price is now retreating towards a flat 20 SMA around 1.5710, whilst the technical indicators have turned lower in positive territory. In the 4 hours chart, the neutral stance prevails, as the price continues to hover around the 20 SMA, whilst the technical indicators are unable to move far from their mid-lines. The key support for the upcoming sessions stands at 1.5645, the 38.2% retracement of the latest daily bullish run.
Support levels: 1.5695 1.5645 1.5610
Resistance levels: 1.5750 1.5795 1.5830
USD/JPY Current price: 122.50
View Live Chart for the USD/JPY
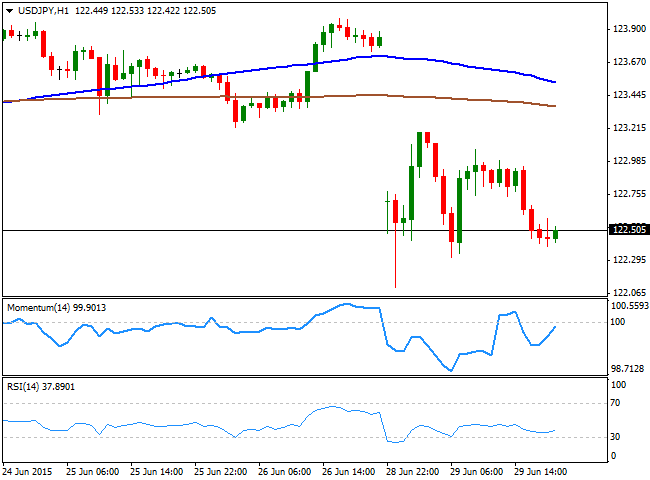
The USD/JPY pair trades around its daily opening, having recovered up to 123.18 intraday, around 65 pips short of closing the weekly opening gap. The Japanese yen resumed its strength after the release of US housing figures, as Pending Home sales for May grew less than expected, reaching 0.9% against the forecast of a 1.2% advance. Having been as low as 122.10 during the previous Asian session, the pair is poised to remain under pressure, as stocks around the world fell sharply. The 1 hour chart shows that the price stands around 100 pips below its 100 and 200 SMAs, whilst the technical indicators are posting some tepid recoveries, but remain in negative territory. In the 4 hours chart, the technical indicators maintain their strong bearish slopes well into negative territory, whilst the intraday recovery was not enough for the price to establish above its 200 SMA, all of which supports the dominant bearish trend.
Support levels: 122.45 122.00 121.60
Resistance levels: 122.90 123.30 123.75
AUD/USD Current price: 0.7705
View Live Chart for the AUD/USD
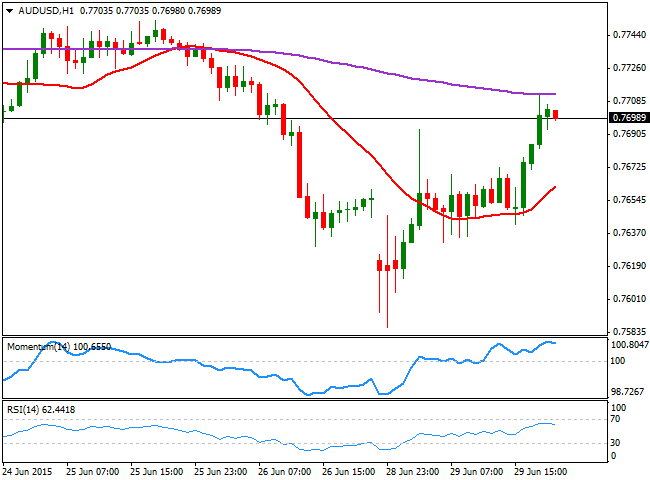
The Australian dollar was among the daily winners, surging against the greenback up to 0.7711 and trading around the 0.7700 figure by the US close. On Saturday, the Chinese Central Bank, the PBoC, cut rates for fourth time in seven months, in a desperate attempt to boost the local economy, supporting Aussie's strength. The 1 hour chart shows that the price stands well above a bullish 20 SMA, currently in the 0.7650 region, whilst the technical indicators are turning slightly lower in positive territory. In the 4 hours chart however, the upside seems limited as the price hovers around a mild bearish 20 SMA a few pips below the current level, whilst the technical indicators have turned south below their mid-lines, after correcting oversold readings reached earlier in the week. A downward acceleration below the 0.7640 level should confirm additional declines for this Tuesday, down to the 0.7530/60 region.
Support levels: 0.7640 0.7590 0.7555
Resistance levels: 0.7720 0.7755 0.7790
Recommended Content
Editors’ Picks
EUR/USD edges lower toward 1.0700 post-US PCE

EUR/USD stays under modest bearish pressure but manages to hold above 1.0700 in the American session on Friday. The US Dollar (USD) gathers strength against its rivals after the stronger-than-forecast PCE inflation data, not allowing the pair to gain traction.
GBP/USD retreats to 1.2500 on renewed USD strength

GBP/USD lost its traction and turned negative on the day near 1.2500. Following the stronger-than-expected PCE inflation readings from the US, the USD stays resilient and makes it difficult for the pair to gather recovery momentum.
Gold struggles to hold above $2,350 following US inflation

Gold turned south and declined toward $2,340, erasing a large portion of its daily gains, as the USD benefited from PCE inflation data. The benchmark 10-year US yield, however, stays in negative territory and helps XAU/USD limit its losses.
Bitcoin Weekly Forecast: BTC’s next breakout could propel it to $80,000 Premium

Bitcoin’s recent price consolidation could be nearing its end as technical indicators and on-chain metrics suggest a potential upward breakout. However, this move would not be straightforward and could punish impatient investors.
Week ahead – Hawkish risk as Fed and NFP on tap, Eurozone data eyed too

Fed meets on Wednesday as US inflation stays elevated. Will Friday’s jobs report bring relief or more angst for the markets? Eurozone flash GDP and CPI numbers in focus for the Euro.
