EUR/USD Current price: 1.0715
View Live Chart for the EUR/USD
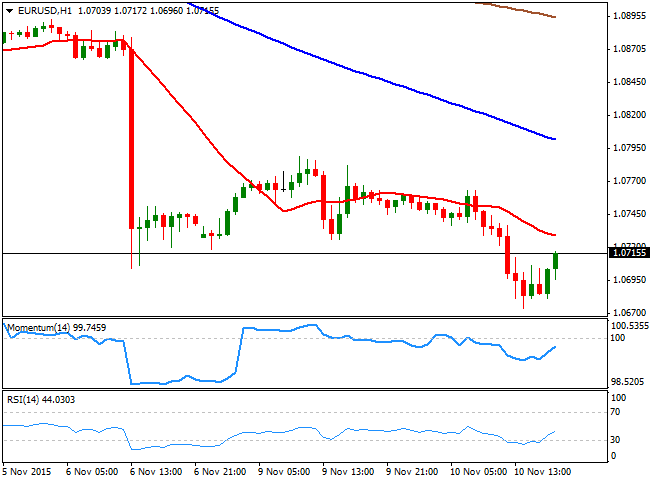
The American dollar came under renewed buying interest early in the US session, rallying to fresh highs against the EUR and the AUD, and maintaining its recent gains against other rivals. Once again, there were no relevant macroeconomic news to guide investors, but the conviction over an upcoming US rate hike next December prevailed, even despite US treasury secretary Lew expressed concerns over international woes affecting the US economy. Nevertheless, his words of caution were not enough to revert the greenback´s upward momentum, and the EUR/USD pair plunged down to 1.0673. The US has a bank holiday this Wednesday, pointing for another quiet trading day in the pair, at least from the fundamental front.Technically, however, and as said on previous updates, the bearish potential is firm in place, with no signs of a change in the long term bias, based on the clear imbalance between both economies' monetary policies. The 1 hour chart shows that the pair has been unable to recover firmly above the 1.0700 level during the American afternoon, trading around the figure by the US close. In the same chart, the 20 SMA heads lower above the current price whilst the technical indicators are bouncing from oversold readings, but remain well below their mid-lines. In the 4 hours chart, the 20 SMA has extended further low, now around 1.0775, while the RSI indicator is barely bouncing from oversold readings and the Momentum indicator aims higher below its 100 level, suggesting an upward corrective movement is under way. A recovery up to 1.081 will hardly affect the ongoing bearish tone, but rather fuel the decline after the upward corrective movement is complete.
Support levels: 1.0660 1.0620 1.0585
Resistance levels: 1.0730 1.0775 1.0810
EUR/JPY Current price: 131.84
View Live Chart for the EUR/JPY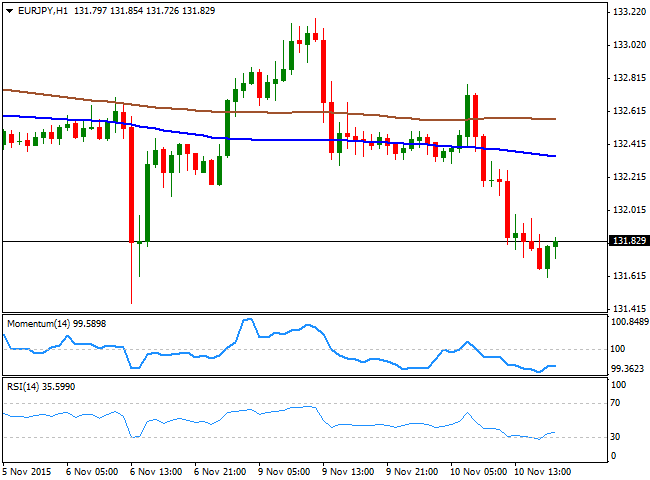
The EUR/JPY pair recovers from a daily low set at 131.61 and holds below the 132.00 by the end of the day, enjoying a short term recovery as the new Minneapolis FED's president, Neel Kashkari, seems to be a dove, and therefore leading to a short term decline in the USD. The pair however, closed well in the red and after recording a lower low and a lower high daily basis, maintaining the negative tone in place. Shorter term, the 1 hour chart shows that the price is developing below the 100 and 200 SMAs, with the shortest around 132.30, whilst the technical indicators are posting tepid bounces from oversold territory. In the 4 hours chart, the technical indicators have reverted their bearish slopes, but remain well into negative territory, whilst the 100 SMA has extended further lower above the current price.
Support levels: 131.65 131.30 130.75
Resistance levels: 132.60 133.10 133.55
GBP/USD Current price: 1.5111
View Live Chart for the GPB/USD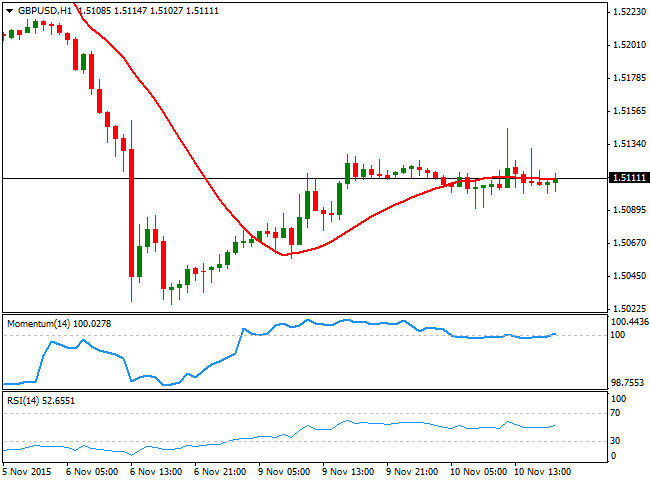
The GBP/USD pair has shown little progress this Tuesday, having traded in a tight 20 pips range for most of a day, and with a short lived spike up to 1.5144 being quickly erased. Overall, the sentiment towards the Pound remains negative after the latest BOE monetary policy meeting, pointing for a delay in the UK rate hike, beyond the first half of 2016 as initially suspected. Anyway, the kingdom will release its latest employment data early Wednesday and expectations are of a steady unemployment rate of 5.4%, whilst 1.6K new people are expected to claim for unemployment benefits. Previous month figures were a huge disappointment, although wages remained strong. If the numbers are again below expectations, the GBP/USD pair can fall down to the 1.5000 figure, and even break below it. Technically, the 1 hour chart shows that the technical readings maintain a neutral stance, with the price stuck around a flat 20 SMA and the technical indicators hovering around their mid-lines. In the 4 hours chart, the price is unable to advance above a bearish 20 SMA, a few pips above the current level, whilst the Momentum indicator aims higher above its 100 line, and the RSI indicator consolidates flat near oversold territory.
Support levels: 1.5080 1.5035 1.5000
Resistance levels: 1.5145 1.5190 1.5250
USD/JPY Current price: 123.13
View Live Chart for the USD/JPY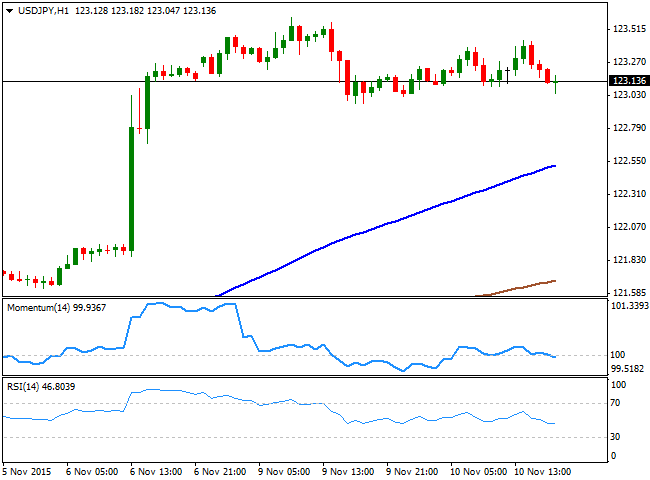
The USD/JPY pair consolidated in a tight range for a second day in-a-row, finding some intraday buying interest on retracements towards the 123.00 level, but holding well below Friday's high of 123.59. The pair has been indifferent to stocks' behavior, as the US indexes opened strongly lower, but later bounced, with the speculative focus still being an upcoming rate hike in the US. The 1 hour chart shows that the price remains in a tight range and far above a bullish 100 SMA, currently around 122.50, while the technical indicators present tepid slopes below their mid-lines. In the 4 hours chart, the Momentum indicator heads sharply lower and is aiming to cross its mid-line towards the downside, while the RSI heads lower around 64, supporting a bearish movement in the short term, to be confirmed on a downward acceleration below 122.95, the immediate support.
Support levels: 122.95 122.50 122.20
Resistance levels: 123.80 124.25 125.00
AUD/USD Current price: 0.7024
View Live Chart for the AUD/USD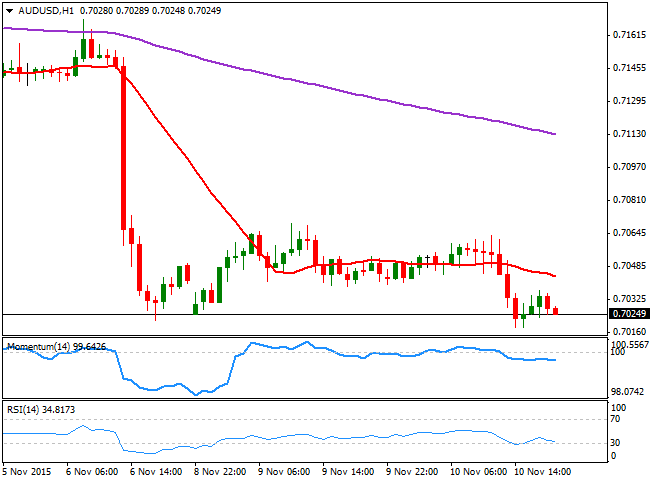
The Australian dollar followed the EUR in its intraday decline, weighed also by a fall in gold prices, which are pressuring last Friday's multi-month lows. The AUD/USD pair 1 hour chart presents a clear bearish tone, as the price is extending below an increasingly bearish 20 SMA, whilst the technical indicators have resumed their declines below their mid-lines, with the RSI heading south around 33 and anticipating additional declines. In the 4 hours chart, the 20 SMA heads sharply lower above the current level, while the RSI indicator is heading lower around 30 and the price holds nears its daily low, all of which supports additional declines, despite the Momentum indicator diverges higher in negative territory. A break below the 0.7000 figure, should lead to a continued decline towards the recent multi-year low of 0.6906 established last September.
Support levels: 0.7000 0.6970 0.6930
Resistance levels: 0.7030 0.7070 0.7110
Information on these pages contains forward-looking statements that involve risks and uncertainties. Markets and instruments profiled on this page are for informational purposes only and should not in any way come across as a recommendation to buy or sell in these assets. You should do your own thorough research before making any investment decisions. FXStreet does not in any way guarantee that this information is free from mistakes, errors, or material misstatements. It also does not guarantee that this information is of a timely nature. Investing in Open Markets involves a great deal of risk, including the loss of all or a portion of your investment, as well as emotional distress. All risks, losses and costs associated with investing, including total loss of principal, are your responsibility. The views and opinions expressed in this article are those of the authors and do not necessarily reflect the official policy or position of FXStreet nor its advertisers. The author will not be held responsible for information that is found at the end of links posted on this page.
If not otherwise explicitly mentioned in the body of the article, at the time of writing, the author has no position in any stock mentioned in this article and no business relationship with any company mentioned. The author has not received compensation for writing this article, other than from FXStreet.
FXStreet and the author do not provide personalized recommendations. The author makes no representations as to the accuracy, completeness, or suitability of this information. FXStreet and the author will not be liable for any errors, omissions or any losses, injuries or damages arising from this information and its display or use. Errors and omissions excepted.
The author and FXStreet are not registered investment advisors and nothing in this article is intended to be investment advice.
Recommended Content
Editors’ Picks
EUR/USD edges lower toward 1.0700 post-US PCE

EUR/USD stays under modest bearish pressure but manages to hold above 1.0700 in the American session on Friday. The US Dollar (USD) gathers strength against its rivals after the stronger-than-forecast PCE inflation data, not allowing the pair to gain traction.
GBP/USD retreats to 1.2500 on renewed USD strength

GBP/USD lost its traction and turned negative on the day near 1.2500. Following the stronger-than-expected PCE inflation readings from the US, the USD stays resilient and makes it difficult for the pair to gather recovery momentum.
Gold struggles to hold above $2,350 following US inflation

Gold turned south and declined toward $2,340, erasing a large portion of its daily gains, as the USD benefited from PCE inflation data. The benchmark 10-year US yield, however, stays in negative territory and helps XAU/USD limit its losses.
Bitcoin Weekly Forecast: BTC’s next breakout could propel it to $80,000 Premium

Bitcoin’s recent price consolidation could be nearing its end as technical indicators and on-chain metrics suggest a potential upward breakout. However, this move would not be straightforward and could punish impatient investors.
Week ahead – Hawkish risk as Fed and NFP on tap, Eurozone data eyed too

Fed meets on Wednesday as US inflation stays elevated. Will Friday’s jobs report bring relief or more angst for the markets? Eurozone flash GDP and CPI numbers in focus for the Euro.
