New update: EUR/USD jumps to 1.1700 after gaining 300 pips in hours
Why? EUR/USD: Why is the buck getting bludgeoned?
Also on a mad move: USD/JPY Forecast: fresh 3-month low
EUR/USD Current price: 1.1516
View Live Chart for the EUR/USD

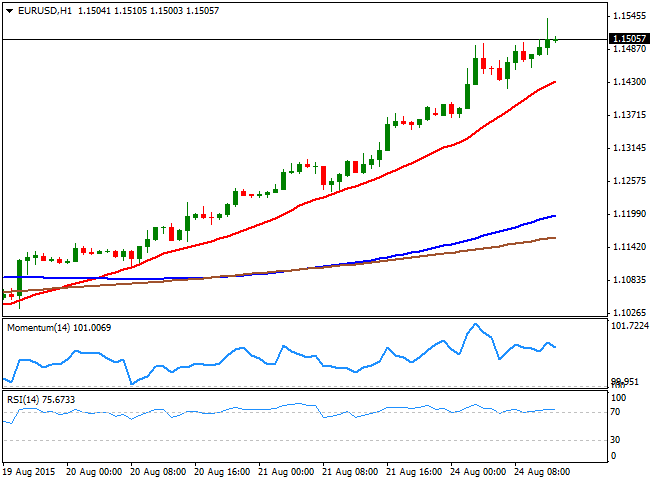
The EUR/USD pair has broken above the 1.1500 figure ahead of the US opening, as stocks continue collapsing, dragging the USD alongside with them. The pair advanced up to 1.1541 before retreating some, but nothing relevant considering the pair added over 150 pips from Friday's close. The main market driver is panic selling in worldwide stocks, as Chinese stocks once again plummeted, this time by 8.5%, driving European equities to fresh year lows.
The pair is now extremely overbought in almost all its charts from daily to lower, but there's not much in the technical front, suggesting the rally is over. Ahead of the US opening the DJIA is already 600 points lower, and the Nasdaq over 200, suggesting the movements may resume after Wall Street opening. The 1 hour chart shows that the technical indicators are losing their upward strength in overbought territory, with the 20 SMA heading higher around 1.1430. In the 4 hours chart however, the RSI holds around 88 whilst the Momentum indicators is also far from supporting a downward correction, all of which points for some consolidation before the next run.
Support levels: 1.1460 1.1420 1.1370
Resistance levels: 1.1540 1.1585 1.1620
GBP/USD Current price: 1.5743
View Live Chart for the GPB/USD
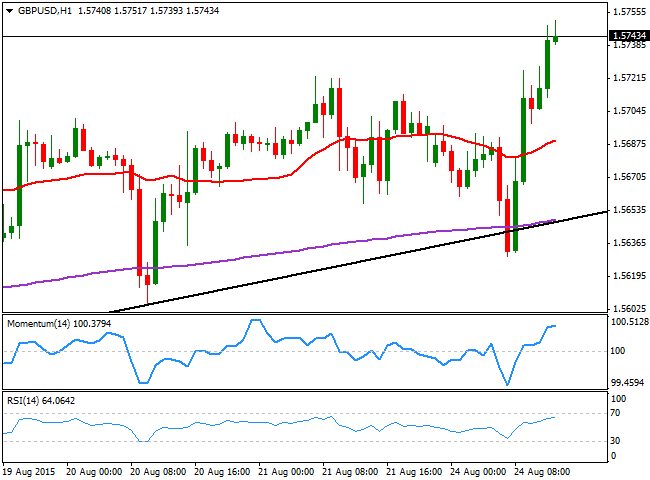
The GBP/USD pair trades at fresh 2-month highs, having finally broken through the 1.5735 level, amid dollar's sell-off. The pair initially dip down to 1.5629, but bounced back early in the European opening, having so far reached highs in the 1.5750 region. Technically the 1 hour chart shows that the technical indicators continue heading higher above their mid-lines, whilst the 20 SMA is gaining a tepid bullish slope in the 1.5680 region. In the 4 hours chart, the Momentum indicator heads sharply higher above the 100 level, whilst the RSI aims higher around 62, with limited upward strength. In the same chart, is clear that the price is finally breaking above its 20 SMA and its recent range, all of which points for further advances, particularly if the pair breaks above 1.5770 the immediate resistance.
Support levels: 1.5735 1.5680 1.5650
Resistance levels: 1.5770 1.5815 1.5840
USD/JPY Current price: 119.90
View Live Chart for the USD/JPY
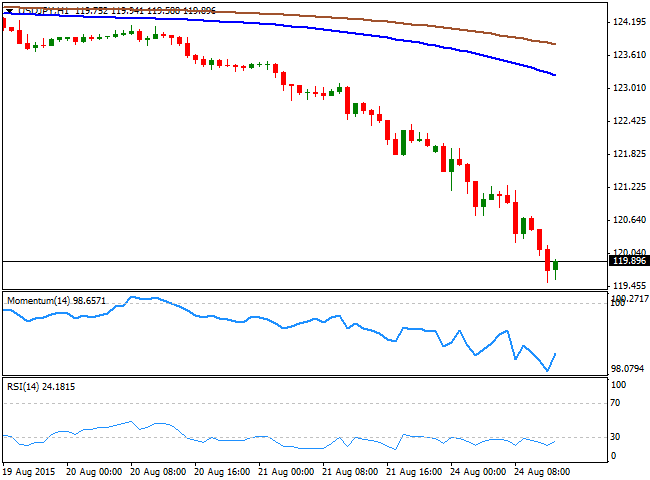
The USD/JPY pair has lost over 200 pips this Monday, collapsing through the 120.00 level ahead of the US opening, and posting a daily low of 119.53 before finally bouncing some. The pair stands at a fresh 3-month low, and the daily chart shows that the price has broken through its 200 DMA, around 121.00, for the first time since August 2014. Technically, the 1 hour chart shows that the technical indicators are supporting a short term upward corrective movement, and if the price manages to regain the 120.00 level, it can advance up to 120.60. Nevertheless, it would take a recovery above 121.00, the mentioned 200 DMA to confirm the bearish trend is over. In the 4 hours chart, the technical indicators maintain their sharp bearish slopes in extreme oversold levels, with the RSI indicator heading south around 8. Given that Wall Street is pointing to open strongly lower, the pair may resume its decline then, with a break below the mentioned daily low exposing a continued decline towards the 118.80 price zone.
Support levels: 119.60 119.20 118.80
Resistance levels: 120.10 120.60 121.00
AUD/USD Current price: 0.7233
View Live Chart for the AUD/USD
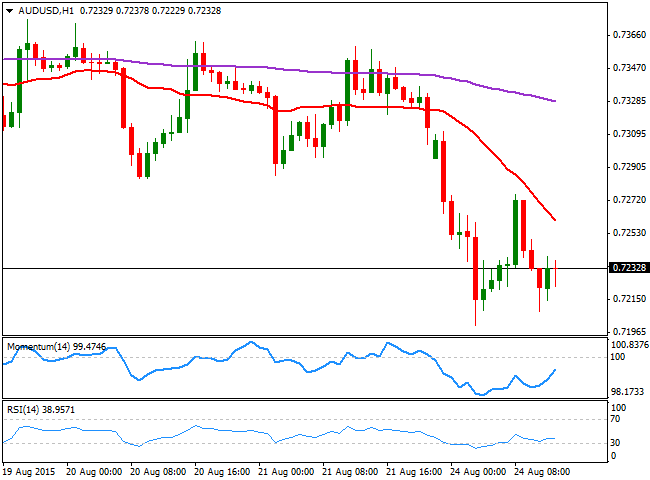
The AUD/USD pair fell down to the 0.7200 level, down during Asian hours amid China's stocks fall. The pair however, bounced in the European opening as investors rushed to sell the greenback, sending the pair up to 0.7275, from where the pair resumed its decline. The Aussie is extremely vulnerable to Chinese turmoil, and commodities also under pressure are surely not helping. The 1 hour chart shows that the Momentum is trying to correct higher below the 100 level, but that the RSI indicator holds flat around 39, whilst the 20 SMA maintains a strong bearish slope, capping the upside around 0.7260. In the 4 hours chart the technical indicators have bounced from oversold levels, but are far from supporting additional gains. The risk remains towards the downside, with a break below 0.7200 pointing for a continued decline towards the 0.7000 figure, later on this week.
Support levels: 0.7200 0.7165 0.7120
Resistance levels: 0.7260 0.7300 0.7345
Recommended Content
Editors’ Picks
EUR/USD edges lower toward 1.0700 post-US PCE

EUR/USD stays under modest bearish pressure but manages to hold above 1.0700 in the American session on Friday. The US Dollar (USD) gathers strength against its rivals after the stronger-than-forecast PCE inflation data, not allowing the pair to gain traction.
GBP/USD retreats to 1.2500 on renewed USD strength

GBP/USD lost its traction and turned negative on the day near 1.2500. Following the stronger-than-expected PCE inflation readings from the US, the USD stays resilient and makes it difficult for the pair to gather recovery momentum.
Gold struggles to hold above $2,350 following US inflation

Gold turned south and declined toward $2,340, erasing a large portion of its daily gains, as the USD benefited from PCE inflation data. The benchmark 10-year US yield, however, stays in negative territory and helps XAU/USD limit its losses.
Bitcoin Weekly Forecast: BTC’s next breakout could propel it to $80,000 Premium

Bitcoin’s recent price consolidation could be nearing its end as technical indicators and on-chain metrics suggest a potential upward breakout. However, this move would not be straightforward and could punish impatient investors.
Week ahead – Hawkish risk as Fed and NFP on tap, Eurozone data eyed too

Fed meets on Wednesday as US inflation stays elevated. Will Friday’s jobs report bring relief or more angst for the markets? Eurozone flash GDP and CPI numbers in focus for the Euro.