EUR/USD Current price: 1.0964
View Live Chart for the EUR/USD
The potential of a Grexit has kept the greenback on demand this Tuesday, with the American currency raising to multi-weeks highs against its European rivals. Fears that the country will run out of cash, with market rumors suggesting the four main banks have only € 100,000 left, and the continued delay in negotiations, have taken their toll over financial markets. The urgency has pushed Athens to request for an interim arrangement to restore liquidity until the end of July, before a longer-term deal is reached, but the creditors are not willing to give any more outside a long term arrangement. The EU summit ended with no news on the matter, and there are high possibilities of another summits to be scheduled during the upcoming days. In the US, the trade balance deficit was $41.9 billion in May, up $1.2 billion from $40.7 billion in April, revised, better-than-expected, whilst the number of job openings was little changed at 5.4 million on the last business day of May, according to the US Bureau of Labor Statistics, supporting the dollar's strength.
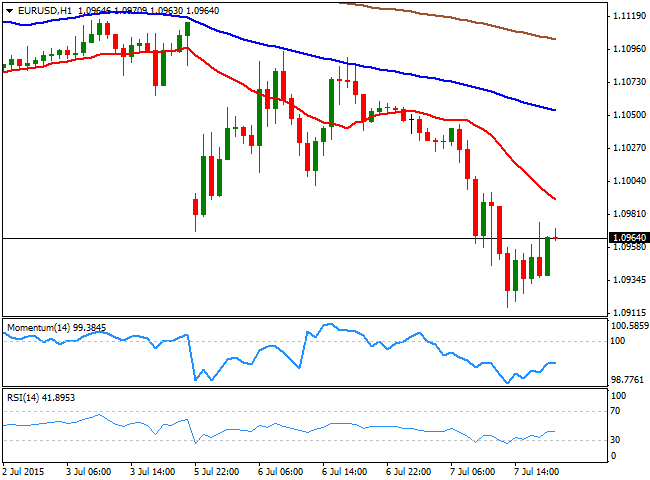
The EUR/USD pair fell down to 1.0915 during the American session, bouncing back to the 1.0960 by the end of the day as investors took profits out of the table due to the highs levels of uncertainty. Technically, however, the bearish bias remains intact in the short term, as the 1 hour chart shows that the price has extended further below its moving averages, with the 20 SMA now reinforcing the static support around 1.1000, whilst the technical indicators have stabilized below their mid-lines, after bouncing from oversold levels. In the 4 hours chart, the indicators are still near oversold territory, whilst the 20 SMA heads strongly lower in the 1.1050 region, supporting the shorter term view. Renewed selling pressure below 1.0920 will likely see the pair resuming its decline down to the 1.0820 region, May 27th daily low.
Support levels: 1.0950 1.0920 1.0880
Resistance levels: 1.1000 1.1050 1.1090
EUR/JPY Current price: 134.17
View Live Chart for the EUR/JPY
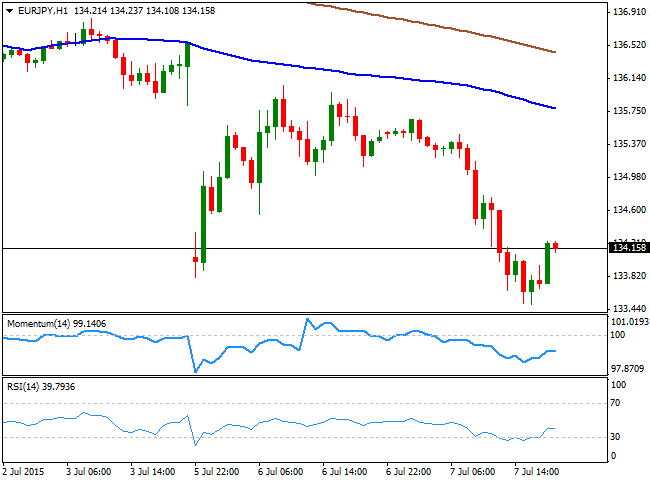
The EUR/JPY plummeted to a fresh 6-week low of 133.50 as the market was in a rush to get rid of its euros. Also, the ongoing risk environment supported the yen demand, resulting in an intraday slide of nearly 200 pips. The pair however, recovered some ground, closing the day a few pips above the 134.00 level after finding buying interest around its daily 100 SMA at the mentioned daily low, but nevertheless, further declines are expected, as the 1 hour chart shows that the 100 and 200 SMAs have extended their bearish slopes above the current price, whilst the technical indicators have resumed their decline after a limited upward corrective movement from oversold readings. In the 4 hours chart, the technical indicators have also bounced from oversold readings, but remain well below their mid-lines, whilst the 100 SMA has accelerated strongly lower, and converges with the 200 SMA in the 137.50/80 region, reflecting the strong selling interest surrounding the pair.
Support levels: 133.90 133.50 133.10
Resistance levels: 134.40 134.80 135.30
GBP/USD Current price: 1.5447
View Live Chart for the GBP/USD
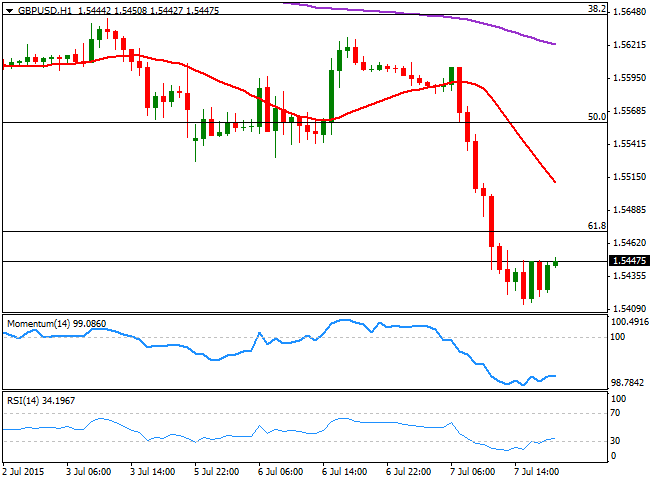
The British Pound fell down to a fresh 4-week low against the greenback, with the pair reaching 1.5412 before finally halting the slide. The Pound was weighed by weaker-than-expected British manufacturing data that fell in May by 0.6% after a fall of 0.4% in April. Industrial output, however, rose by 0.4% in the same month, above market's expectations, boosted by oil and gas production. The bad figures were attributed to the recent advance of the Pound that made local products more expensive for foreign buyers. The GBP/USD pair has barely recovered ground during the last trading hours, with the 1 hour chart showing that the 20 SMA has extended sharply above the current price, offering now a dynamic resistance in the 1.5510 region, whilst the technical indicators have barely corrected oversold readings before losing their upward strength. In the 4 hours chart the RSI indicator has also turned higher, but remains in oversold territory, whilst the price has broken below the 61.8% retracement of its latest bullish run, at 1.5475, now the immediate resistance. As long as this level holds, the pair will remain exposed towards the downside, with a break below the 1.5400 figure pointing for a test of the 1.5200 region during the upcoming sessions.
Support levels: 1.5400 1.5360 1.5325
Resistance levels: 1.5475 1.5510 1.5555
USD/JPY Current price: 122.41
View Live Chart for the USD/JPY
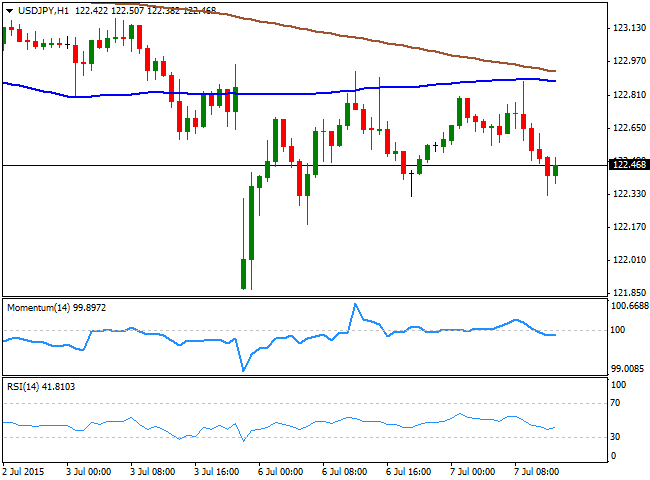
The USD/JPY pair closed the day in the red, having been as low as 122.00 mid American afternoon, on the back of market's run towards safety. A sharp bounce in US indexes before the closing bell however, has helped the pair erasing half of its intraday gains. The pair maintains the bearish tone seen on previous updates, with the 1 hour chart showing that the 100 and 200 SMAs offering a strong dynamic resistance zone around 122.80/90, whilst the technical indicators have lost their upward strength in negative territory after correcting oversold readings. In the 4 hours chart, the bearish potential seems more limited, as the technical indicators are extending their advances below their mid-lines, with the Momentum indicator getting closer to regain the 100 level. Nevertheless, former lows around 122.45 are attracting some intraday selling interest, so it will take a strong advance above the level to confirm some upward relief rally. A break below 122.00 on the other hand, should lead to test of the 121.20 level, the 100 DMA.
Support levels: 122.00 121.60 121.20
Resistance levels: 122.45 122.95 123.30
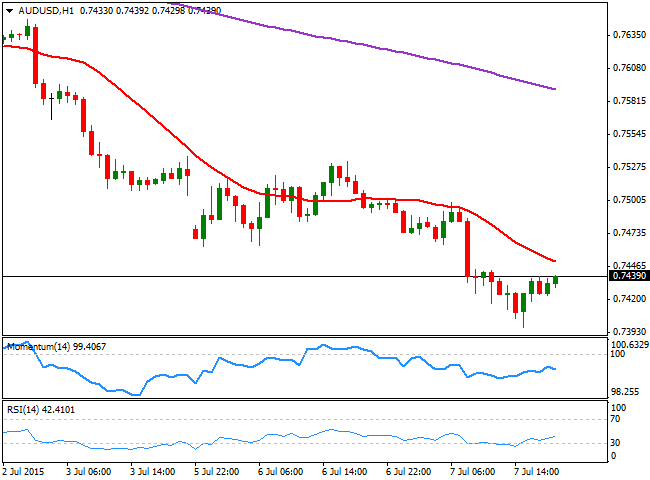
AUD/USD Current price: 0.7439
View Live Chart for the AUD/USD
The Australian dollar reached a fresh 6-year low against its American rival of 0.7397, having been in selling mode ever since the RBA economic policy decision during the past Asian session. The Central Bank has left its economic policy unchanged, but stated that "further depreciation seems both likely and necessary, particularly given the significant declines in key commodity prices." Given the fact that commodities were smashed this Tuesday on Chinese stocks' markets turmoil, the AUD seems poised to continue falling after a limited upward corrective movement. Short term the 1 hour chart shows that the 20 SMA heads lower around 0.7450 whilst the technical indicators head south below their mid-lines. In the 4 hours chart, the RSI indicator has tuned flat around 31, whilst the Momentum indicator has lost its upward strength in negative territory, after correcting oversold readings, all of which supports a downward continuation, particularly on a break below the 0.7400 level.
Support levels: 0.7400 0.7370 0.7330
Resistance levels: 0.7450 0.7500 0.7545
Recommended Content
Editors’ Picks
EUR/USD edges lower toward 1.0700 post-US PCE

EUR/USD stays under modest bearish pressure but manages to hold above 1.0700 in the American session on Friday. The US Dollar (USD) gathers strength against its rivals after the stronger-than-forecast PCE inflation data, not allowing the pair to gain traction.
GBP/USD retreats to 1.2500 on renewed USD strength

GBP/USD lost its traction and turned negative on the day near 1.2500. Following the stronger-than-expected PCE inflation readings from the US, the USD stays resilient and makes it difficult for the pair to gather recovery momentum.
Gold struggles to hold above $2,350 following US inflation

Gold turned south and declined toward $2,340, erasing a large portion of its daily gains, as the USD benefited from PCE inflation data. The benchmark 10-year US yield, however, stays in negative territory and helps XAU/USD limit its losses.
Bitcoin Weekly Forecast: BTC’s next breakout could propel it to $80,000 Premium

Bitcoin’s recent price consolidation could be nearing its end as technical indicators and on-chain metrics suggest a potential upward breakout. However, this move would not be straightforward and could punish impatient investors.
Week ahead – Hawkish risk as Fed and NFP on tap, Eurozone data eyed too

Fed meets on Wednesday as US inflation stays elevated. Will Friday’s jobs report bring relief or more angst for the markets? Eurozone flash GDP and CPI numbers in focus for the Euro.
