EUR/USD Current price: 1.1120
View Live Chart for the EUR/USD
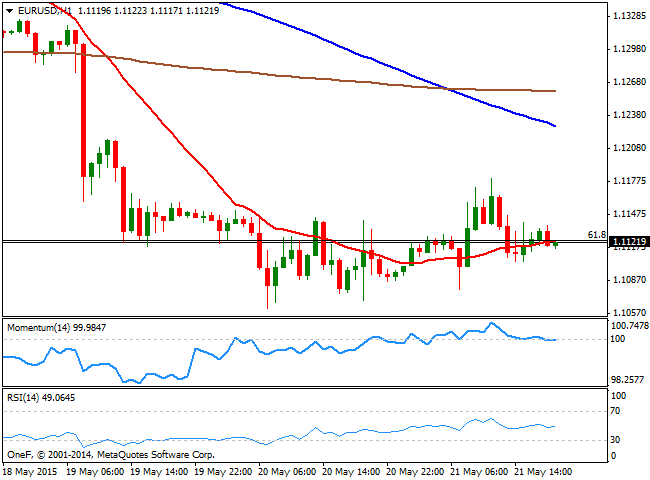
The American dollar edged lower across the board, albeit the common currency was unable to settle above the 1.1120 Fibonacci area. The pair surged early Europe to a 2-day high of 1.1180, despite growth in the region resulted disappointing in May, according to the latest Markit PMI figures, which showed a slowdown in German output, and worse-than-expected readings in the Service sector for France and the EU. Consumer confidence in the region released later on in the day, fell down to -5.5 in April, versus .4.6 the previous month. In the US however, things did not look better, as weekly unemployment claims came out at 274K for the week ended May 15th, whilst the Markit Manufacturing PMI missed expectations, alongside with Existing Home Sales.
Nevertheless, the pair was unable to hold on to its gains and turned back south with the US opening, trading a handful of pips above its daily opening and with the short term picture turning bearish, as the 1 hour chart shows that the price stands below its 20 SMA and that the technical indicators are aiming to cross their mid-lines towards the downside. In the 4 hours chart, the Momentum indicator continues to head north below 100, although the RSI has turned lower around 39, whilst the 20 SMA maintains a strong bearish slope now capping the upside around the mentioned daily high. An upward extension above this last can see the pair extending up to 1.1250, although selling interest is expected to surge around this last and contain the upside.
Support levels: 1.1050 1.1000 1.0955
Resistance levels: 1.1170 1.1220 1.1250
EUR/JPY Current price: 134.60
View Live Chart for the EUR/JPY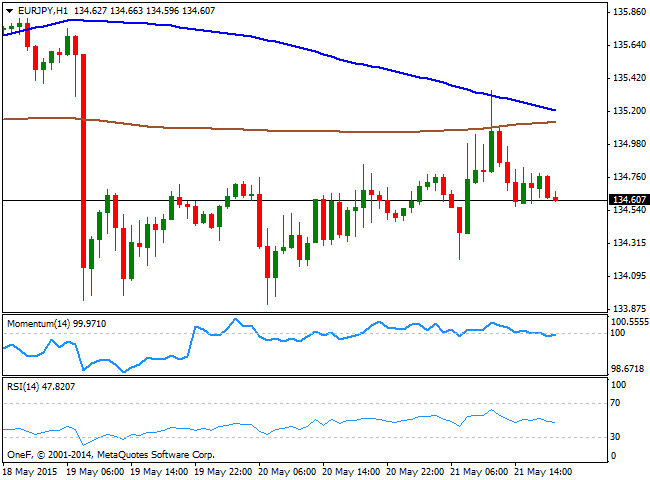
The EUR/JPY closes a second day in a row in the 134.60 region, having traded as high as 135.34 earlier in the day, finally weighed by self EUR weakness. The 1 hour chart shows that the price retreated from its 100 SMA, now approaching to the 200 SMA in the 135.10 region, whilst the technical indicators present a mild negative tone in neutral territory. In the 4 hours chart, the pair continues to struggle around a bullish 100 SMA, while the Momentum indicator heads higher below 100. In this last time frame however, the RSI has turned lower, now around 45, limiting chances of a stronger recovery. The cross however, needs to accelerate below the 134.00 figure to gain bearish momentum, eyeing a downward extension towards the 133.20 region for this Friday.
Support levels: 134.00 133.60 133.20
Resistance levels: 135.00 135.55 136.10
GBP/USD Current price: 1.5668
View Live Chart for the GBP/USD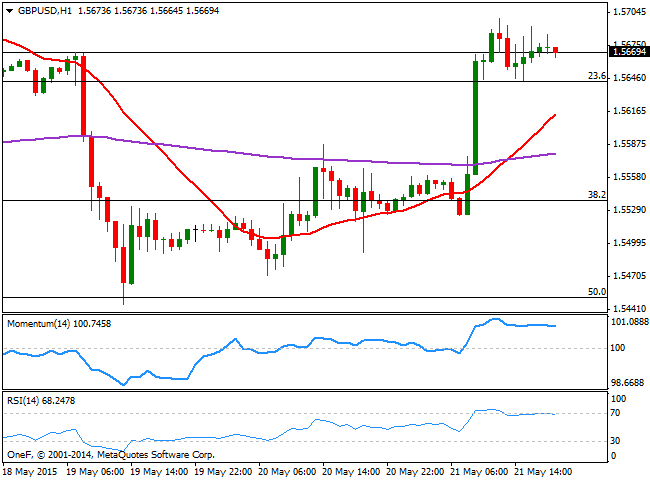
The British Pound posted a strong recovery this Thursday, following the release of up beating UK Retail Sales data that surged 1.2% monthly basis in April and 4.7% in the same month, but compared to a year before. After testing the 50% retracement of its latest bullish rally earlier this week, the pair trades now above the 23.6% retracement of the same rally around 1.5640, having been as high as 1.5699, suggesting the downward corrective movement is complete, and that the pair may advance towards fresh year highs. Short term, the 1 hour chart shows that the 20 SMA maintains a strong bullish slope, providing support around 1.5610, whilst the technical indicators have turned horizontal in overbought territory. In the 4 hours chart, the Momentum indicator maintains a sharp upward slope, whilst the RSI indicator aims back higher around 58, all of which supports additional gains should the price extend beyond the 1.5700 figure, the immediate resistance.
Support levels: 1.5640 1.5600 1.5550
Resistance levels: 1.5700 1.5735 1.5780
USD/JPY Current price: 121.04
View Live Chart for the USD/JPY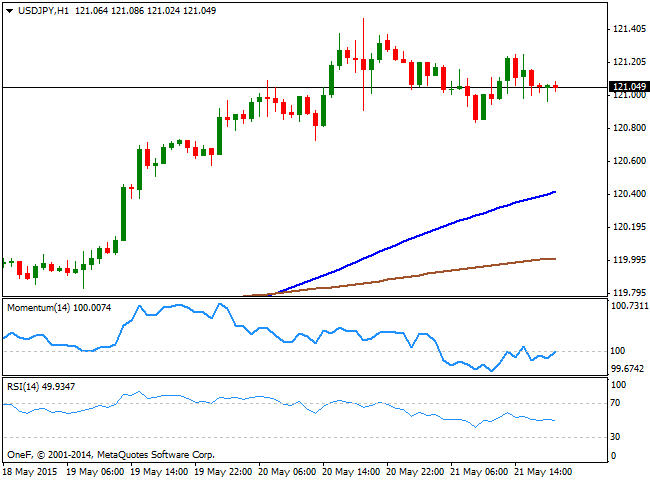
The USD/JPY pair consolidated its latest gains, having traded in quite a limited range between 120.83 and 121.27, holding above the 121.00 figure for most of the day, but challenging it by the US close amid dollar weakness. The BOJ will announce its latest monetary policy decision during the upcoming Asian session, which may imprint some volatility to the pair. If the Central Bank maintains its policy unchanged, the Japanese yen may strengthen in the short term, albeit the pair needs to break below the 120.45 support to confirm a bearish continuation. In the 1 hour chart, the price continues to develop well below the 100 and 200 SMAs, whilst the technical indicators stand in negative territory. In the 4 hours chart the technical indicators have turned lower from overbought levels, supporting an intraday bearish corrective movement, but should remain short lived, particularly if the mentioned level holds.
Support levels: 120.85 120.45 120.10
Resistance levels: 121.45 121.70 122.10
AUD/USD Current price: 0.7893
View Live Chart for the AUD/USD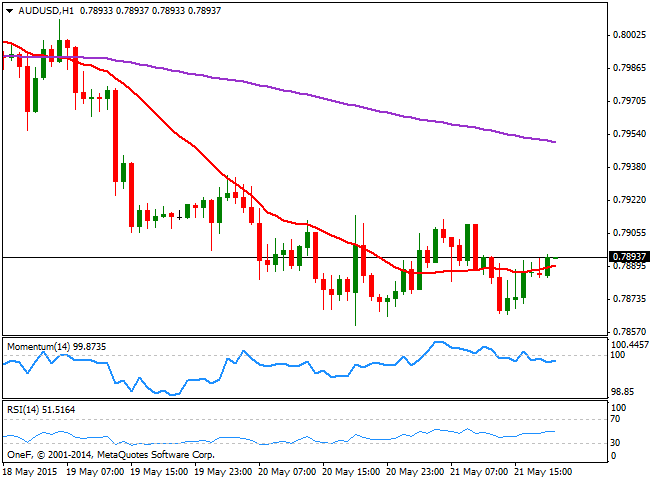
The Australian dollar consolidated around its weekly low against the greenback, having recovered from a daily low of 0.7866, but being unable to regain the 0.7900 figure. Ever since the RBA opened doors for additional rate cuts this year, the Aussie has been under pressure, with intraday recoveries seen as selling opportunities. Technically, the 1 hour chart shows that the pair is in a consolidative stage, as the price hovers around a horizontal 20 SMA, whilst the technical indicators present mild bearish slopes around their mid-lines. In the 4 hours chart, the price stands a few pips above its 200 EMA, still unable to run below it, while the 20 SMA maintains a strong bearish slope, providing dynamic resistance around 0.7920. Also, in this last time frame, the RSI returned south around 39 while the Momentum indicator heads higher below 100, all of which maintains the risk towards the downside.
Support levels: 0.7860 0.7825 0.7790
Resistance levels: 0.7920 0.7955 0.7990
Recommended Content
Editors’ Picks
EUR/USD edges lower toward 1.0700 post-US PCE

EUR/USD stays under modest bearish pressure but manages to hold above 1.0700 in the American session on Friday. The US Dollar (USD) gathers strength against its rivals after the stronger-than-forecast PCE inflation data, not allowing the pair to gain traction.
GBP/USD retreats to 1.2500 on renewed USD strength

GBP/USD lost its traction and turned negative on the day near 1.2500. Following the stronger-than-expected PCE inflation readings from the US, the USD stays resilient and makes it difficult for the pair to gather recovery momentum.
Gold struggles to hold above $2,350 following US inflation

Gold turned south and declined toward $2,340, erasing a large portion of its daily gains, as the USD benefited from PCE inflation data. The benchmark 10-year US yield, however, stays in negative territory and helps XAU/USD limit its losses.
Bitcoin Weekly Forecast: BTC’s next breakout could propel it to $80,000 Premium

Bitcoin’s recent price consolidation could be nearing its end as technical indicators and on-chain metrics suggest a potential upward breakout. However, this move would not be straightforward and could punish impatient investors.
Week ahead – Hawkish risk as Fed and NFP on tap, Eurozone data eyed too

Fed meets on Wednesday as US inflation stays elevated. Will Friday’s jobs report bring relief or more angst for the markets? Eurozone flash GDP and CPI numbers in focus for the Euro.