EUR/USD Current price: 1.0738
View Live Chart for the EUR/USD
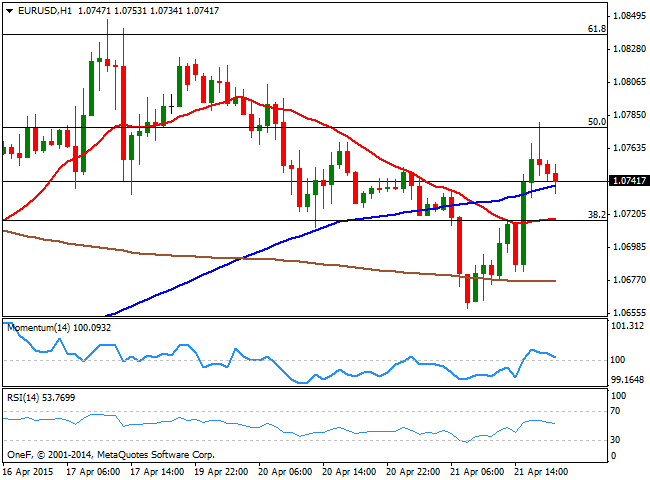
It was a volatile Tuesday, with the dollar staring the day higher, and ending it generally lower across the board. The early boost was triggered by headlines suggesting the ECB was planning to tighten Greek´s use of the Emergency Liquidity Assistance (ELA), ahead of the maturity of €1B due to the IMF in May. But as the day went by, news coming from that front showed that the country will most likely be able to face its payments during May, helping the EUR/USD pair recover from a daily low of 1.0659 to a high around 1.0780. The Greek drama extended during late US session, as Greece PM Varoufakis said that the country will reach a deal with its creditors, although the market did not react to this last. Earlier in the day, the German ZEW survey for April showed that the local economic sentiment fell for the first time since October 2014, down to 53.3 from previous 54.8, while the European economic sentiment improved above expected in the same month.
Technically, the 1 hour chart shows that the price is retreating from the 50% retracement of its latest bearish run, as the price hovers around a mild bullish 100 SMA. In the same chart, the 20 SMA offers support around 1.0715, converging with the 38.2% retracement of the same rally, while the technical indicators turned lower in positive territory towards their mid-lines. In the 4 hours chart the previous candle presents a long upward wick, which reflects sellers are still willing to intervene on spike higher, whilst the technical indicators stand directionless below their mid-lines, maintaining the upside limited.
Support levels: 1.0715 1.0680 1.0640
Resistance levels: 1.0745 1.0780 1.0820
EUR/JPY Current price: 128.49
View Live Chart for the EUR/JPY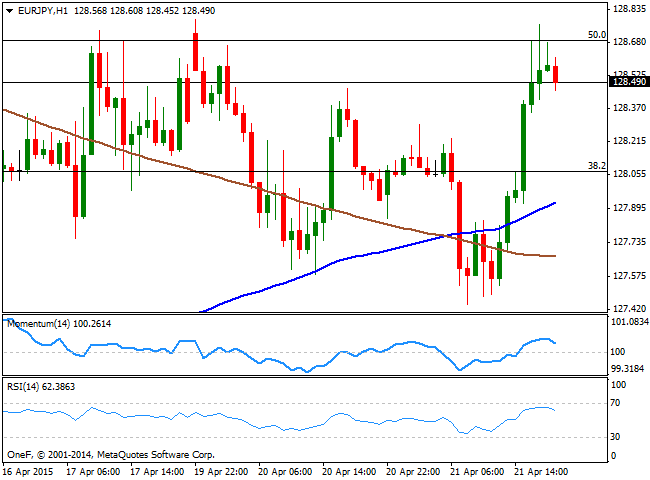
The EUR/JPY surged up to recent highs, posting a daily high of 128.76 before retracing some, as yen traded generally lower across the board whilst the EUR gain on relief. The 1 hour chart for the pair shows that the price stalled for the third time around the 50% retracement of its latest daily slide, but remains above its moving averages, with the 100 SMA heading higher after crossing the 200 SMA, and the technical indicators losing their upward potential in positive territory. In the 4 hours chart the price hit its 100 SMA around the mentioned daily high and with a strong bearish slope, whilst the technical indicators head slightly higher around their mid-lines, limiting short term slides.
Support levels: 127.70 127.30 126.90
Resistance levels: 128.40 128.80 129.20
GBP/USD Current price: 1.4930
View Live Chart for the GBP/USD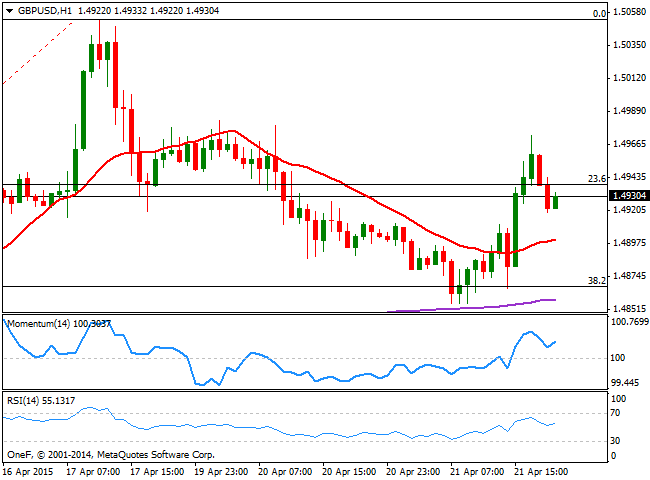
The GBP/USD pair erased most of its Monday losses, surging to a daily high of 1.4972 on the back of a sudden change in market's sentiment during the American afternoon. The UK will publish its latest BOE Minutes early on Wednesday, and expectations are that the 9 MPC voting members have preferred to remain in hold, in which case it won't have any effect on the Pound's value. Technically, the daily chart shows that, despite closing the day in the green, the pair has set a lower high and a lower low daily basis, this last at 1.4855, which limits the upside in the wider view. In the short term, the 1 hour chart shows that the price stands above a bullish 20 SMA, whilst the technical indicator head higher above their mid-lines, suggesting a probable retest of the 1.5000 level during the upcoming hours. In the 4 hours chart, the price is struggling around a flat 20 SMA, whilst the technical indicators are now flat right below their mid-lines, presenting a quite neutral stance. The pair has a static Fibonacci resistance around 1.4940, which means renewed buying interest above the level may lead to an approach to the 1.5000/40 price zone.
Support levels: 1.4910 1.4870 1.4830
Resistance levels: 1.4940 1.4985 1.5040
USD/JPY Current price: 119.65
View Live Chart for the USD/JPY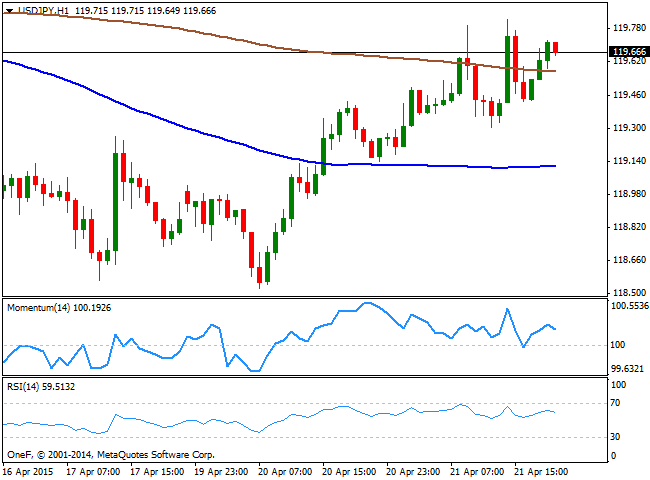
The USD/JPY pair surged to a fresh 5-day high of 119.82, trading a handful of pips below it by the end of the day. During the upcoming hours, Japan will release its Trade Balance figures for March, expected to post a ¥50.0B from previous deficit of ¥-424.6B, whilst exports are expected to have grew by 8.5%. The data may favor the local currency, albeit the reaction to the news may be short lived as the pair is catching bids on slides. Technically, the 1 hour chart shows that short term buyers are now standing around 119.30, and that the price holds above its 200 SMA, whilst the technical indicators are turning lower well above their mid-lines. In the 4 hours chart, the technical tone is clearly bullish, with the Momentum indicator heading higher well above its mid-line, and the RSI indicator consolidating around 58. The pair needs to advance beyond 120.15 to confirm a stronger intraday advance, up to the 120.80 price zone.
Support levels: 119.30 118.90 118.50
Resistance levels: 119.80 120.10 120.50
AUD/USD Current price: 0.7706
View Live Chart for the AUD/USD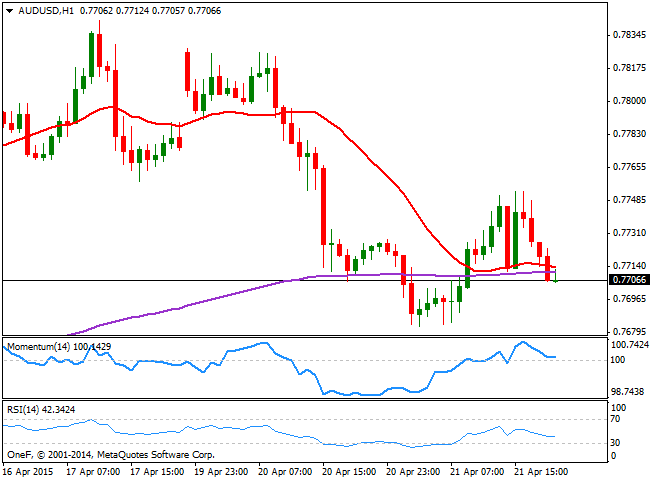
The Australian dollar maintains a heavy tone against most rivals, weighed by RBA's Governor Glenn Stevens latest words, as he said that Australia's central bank is willing to cut interest rates again if needed, but is cautious about the likely impact on house prices and debt levels. The country will release its inflation figures for the Q1 in the upcoming Asian session, expected at 1.3% yearly basis, against a previous reading of 1.7%. Weaker-than-expected CPI figures should pressure even further the Aussie that currently struggles around the 0.7700 level against the greenback. Technically, the short term picture for the AUD/USD pair favors the downside, as the price stands below its 20 SMA while the technical indicators head lower around their mid-lines. In the 4 hours chart, the 20 SMA presents a strong bearish slope in the 0.7750 region, whilst the technical indicators head lower in negative territory, supporting additional declines on a break below 0.685, the immediate support.
Support levels: 0.7685 0.7640 0.7600
Resistance levels: 0.7740 0.7775 0.7810
Recommended Content
Editors’ Picks
EUR/USD edges lower toward 1.0700 post-US PCE

EUR/USD stays under modest bearish pressure but manages to hold above 1.0700 in the American session on Friday. The US Dollar (USD) gathers strength against its rivals after the stronger-than-forecast PCE inflation data, not allowing the pair to gain traction.
GBP/USD retreats to 1.2500 on renewed USD strength

GBP/USD lost its traction and turned negative on the day near 1.2500. Following the stronger-than-expected PCE inflation readings from the US, the USD stays resilient and makes it difficult for the pair to gather recovery momentum.
Gold struggles to hold above $2,350 following US inflation

Gold turned south and declined toward $2,340, erasing a large portion of its daily gains, as the USD benefited from PCE inflation data. The benchmark 10-year US yield, however, stays in negative territory and helps XAU/USD limit its losses.
Bitcoin Weekly Forecast: BTC’s next breakout could propel it to $80,000 Premium

Bitcoin’s recent price consolidation could be nearing its end as technical indicators and on-chain metrics suggest a potential upward breakout. However, this move would not be straightforward and could punish impatient investors.
Week ahead – Hawkish risk as Fed and NFP on tap, Eurozone data eyed too

Fed meets on Wednesday as US inflation stays elevated. Will Friday’s jobs report bring relief or more angst for the markets? Eurozone flash GDP and CPI numbers in focus for the Euro.