EUR/USD Current price: 1.2366
View Live Chart for the EUR/USD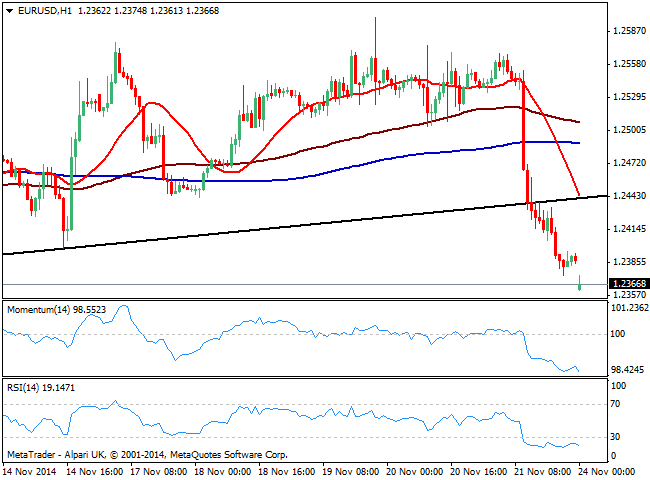
The EUR/USD pair gaps lower as a new week starts, with the dollar extending its gains particularly against its European rivals, compliments to ECB’s head Mario Draghi. Despite not saying anything new, his remarks in a conference in Frankfurt about doing whatever it takes to raise inflation and inflation expectations ended up triggering a selloff in the EUR/USD pair that erased all of its early week gains. Technically the downward pressure persists in the short term, as the 1 hour chart shows price challenging its year low, extending below the trend line broken with Draghi, as indicators head strongly south in extreme oversold territory and moving averages stand well above current price. In the 4 hours chart momentum heads vertically lower, as RSI stands at 28 and 20 SMA turns south following a weekly opening gap of around 30 pips. Markets will be thinner than usual this Monday, so beware of large spikes followed by quiet consolidation; the pair may attempt to fill the gap, yet as long as below 1.2400 the downside is favored with a downward acceleration below 1.2360 opening doors for a run down to 1.2280.
Support levels: 1.2360 1.2325 1.2280
Resistance levels: 1.2400 1.2440 1.2485
EUR/JPY Current price: 145.77
View Live Chart for the EUR/JPY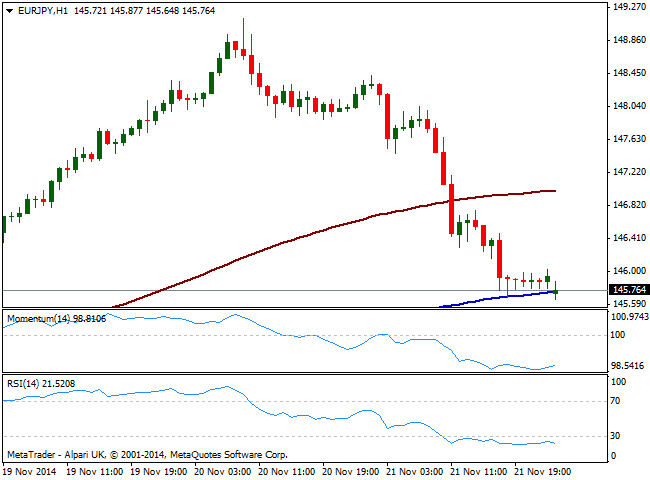
The EUR/JPY suffered from both, a stronger yen and a weaker Euro, resulting in a nearly 250 pips slide last Friday that anyway extends with the weekly opening. The 1 hour chart shows price pressuring its 200 SMA, level that held last American session, while indicators remain directionless in extreme oversold levels. In the 4 hours chart however, indicators present a strong downward momentum that suggests a downward continuation for the upcoming sessions: a downward acceleration through 145.50 immediate support should see the pair extending down to November 17th low around 144.80, where yen sellers may halt the bleeding. However, if Euro weakness persists, the pair can finally break below it, eyeing then the 144.00 mark.
Support levels: 145.50 144.80 144.25
Resistance levels: 146.40 147.00 147.65
GBP/USD Current price: 1.5647
View Live Chart for the GBP/USD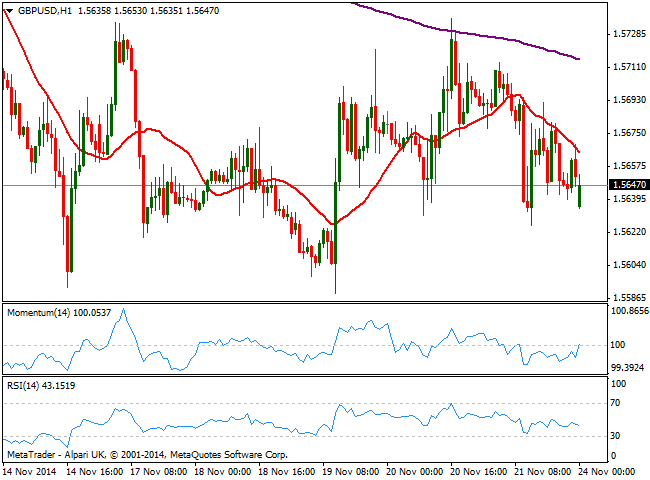
Having posted a year low last week at 1.5589, the GBP/USD has spent these last trading days in consolidation mode right above it. Intraday attempts of recovery remained shy of 1.5770, a critical midterm resistance and sellers will likely maintain the lead as long as the level holds. Technically, the dominant bearish trend remains quite clear daily basis, exposing the pair to a test of the critical figure of 1.5500 during the upcoming days. As for the next 24 hours, the 1 hour chart shows price contained by its 20 SMA that gains bearish slope, as indicators extend below their midlines pointing for some continued losses. In the 4 hours chart a mild bearish tone prevails but 20 SMA stands flat as per recent range, whilst indicators aim lower right below their midlines, lacking strength at the time being. The 1.5590 price zone, challenged twice already this month is the critical support to break as price acceleration below it should confirm a new leg south towards mentioned 1.5500 level.
Support levels: 1.5610 1.5585 1.5550
Resistance levels: 1.5695 1.5740 1.5770
USD/JPY Current price: 117.86
View Live Chart for the USD/JPY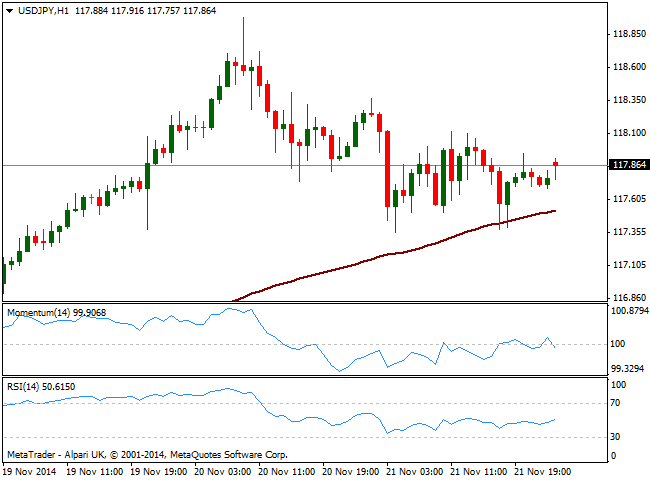
The USD/JPY closed with some limited losses last week, despite US index posted a fifth consecutive week of gains and American data resulted overall positive; nevertheless, market seems to be realizing the pair has gone too far too late, and some midterm consolidation should be expected. With Japan technically in recession according to the latest GDP figures however, deeper moves in the pair are unlikely beyond temporal profit taking movements, and the most likely scenario is buyers taking their chances on those dips. In the meantime, the short term picture as the week starts shows price steady above its hourly moving averages, with 100 SMA offering short term support around 117.45 and indicators heading higher above their midlines. In the 4 hours chart indicators are aiming slightly higher right above their midlines, not yet denying the possibility of further declines. A recovery above 118.20 is required to see the pair regaining the upside, whilst deeps down to 116.50 will be seen as buying opportunities, hardly affecting the dominant trend.
Support levels: 117.45 117.10 116.50
Resistance levels: 118.20 118.60 119.00
AUD/USD Current price: 0.8675
View Live Chart of the AUD/USD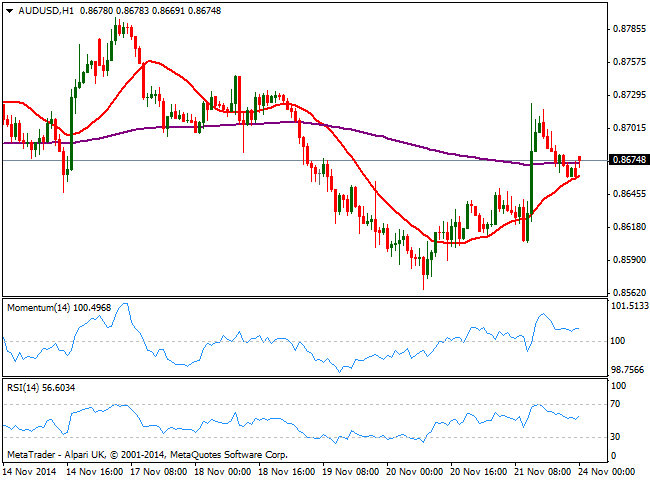
Australian dollar surged above the 0.8700 level against the greenback on the back of PBOC’s decision of cutting it 1 year lending rate by 0.4% and the year deposit rates by 0.25% to 2.75% in an attempt to boost the economy, spurring demand of higher yielders: commodity currencies got a nice spike with the news, yet sellers sent the pair back down, in line with the generalized sentiment triggered by RBA that the pair is trading above its fundamental value. As a new week starts the 1 hour chart shows price gapping higher, holding above a still bullish 20 SMA as indicators stand flat in positive territory. In the 4 hours chart price stands above a bearish 20 SMA as indicators stand flat above their midlines, lacking upward strength. Some steady consolidation above 0.8700 is required to see the pair attracting buyers, yet if 0.8650 gives up, the downside is exposed towards 0.8590 today.
Support levels: 0.8650 0.8625 0.8590
Resistance levels: 0.8700 0.8740 0.8785
Recommended Content
Editors’ Picks
EUR/USD edges lower toward 1.0700 post-US PCE

EUR/USD stays under modest bearish pressure but manages to hold above 1.0700 in the American session on Friday. The US Dollar (USD) gathers strength against its rivals after the stronger-than-forecast PCE inflation data, not allowing the pair to gain traction.
GBP/USD retreats to 1.2500 on renewed USD strength

GBP/USD lost its traction and turned negative on the day near 1.2500. Following the stronger-than-expected PCE inflation readings from the US, the USD stays resilient and makes it difficult for the pair to gather recovery momentum.
Gold struggles to hold above $2,350 following US inflation

Gold turned south and declined toward $2,340, erasing a large portion of its daily gains, as the USD benefited from PCE inflation data. The benchmark 10-year US yield, however, stays in negative territory and helps XAU/USD limit its losses.
Bitcoin Weekly Forecast: BTC’s next breakout could propel it to $80,000 Premium

Bitcoin’s recent price consolidation could be nearing its end as technical indicators and on-chain metrics suggest a potential upward breakout. However, this move would not be straightforward and could punish impatient investors.
Week ahead – Hawkish risk as Fed and NFP on tap, Eurozone data eyed too

Fed meets on Wednesday as US inflation stays elevated. Will Friday’s jobs report bring relief or more angst for the markets? Eurozone flash GDP and CPI numbers in focus for the Euro.