EUR/USD Current price: 1.2662
View Live Chart for the EUR/USD
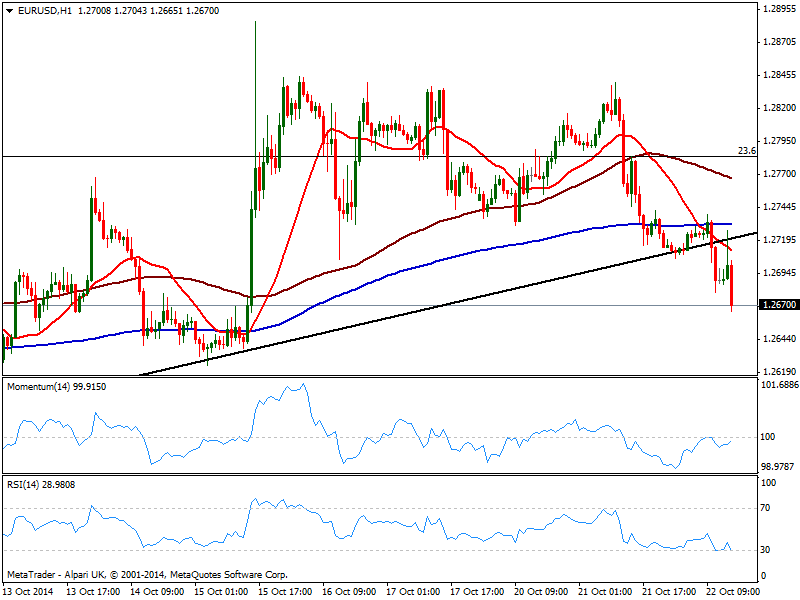
Not a good day for EUR: adding to early weakness due to market rumors on failing banks over the test the ECB is leading and will release next October 26th, US inflation came out better than expected, with both monthly and yearly readings ticking higher. The EUR/USD trades at a fresh 5 day low near 1.2660 static support, with the 20 SMA presenting a strong bearish slope above current price and capping the upside now in the 1.2710 price zone. Indicators stand in negative territory, with RSI pressuring 70 and momentum still not reflecting latest slide. In the 4 hours chart technical readings present a strong bearish tone, which supports further declines on a break below mentioned support.
Support levels: 1.2660 1.2620 1.2580
Resistance levels: 1.2700 1.2740 1.2790
GBP/USD Current price: 1.6037
View Live Chart for the GBP/USD
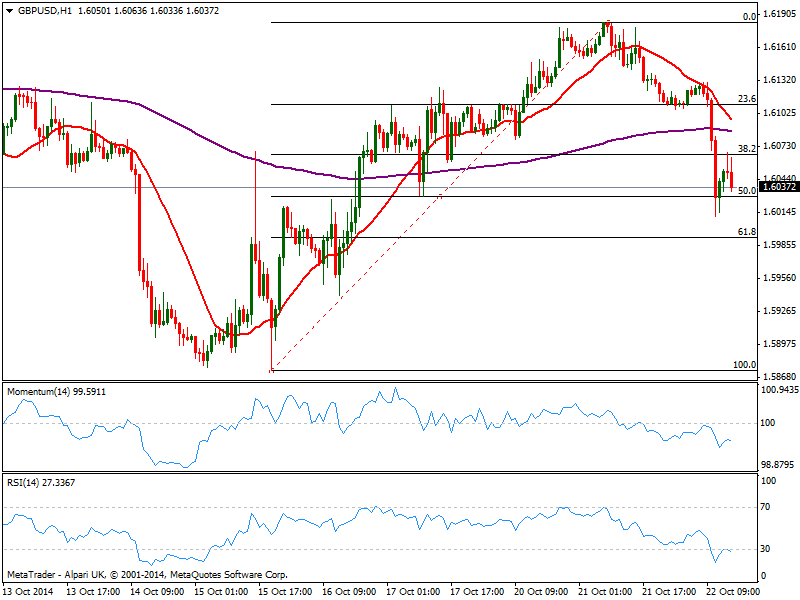
BOE Minutes expressing concerns over European slowdown stalling UK growth sent GBP/USD to a daily low of 1.6011, before a shallow bounce. Price however was unable to extend above the 38.2% retracement of the latest bullish run around 1.6065, and regained the downside on US positive news: the 1 hour chart shows price developing below a bearish 20 SMA, while indicators resumed the downside after partially correcting oversold readings. In the 4 hours chart technical readings also present a strong bearish momentum, with critical support now at 1.5995, 61.8% retracement of the same rally: a break below should anticipate a downward acceleration, eyeing 1.5950 as next probable bearish target in the short term.
Support levels: 1.5995 1.5950 1.5910
Resistance levels: 1.6065 1.6090 1.6125
USD/JPY Current price: 107.21
View Live Chart for the USD/JPY
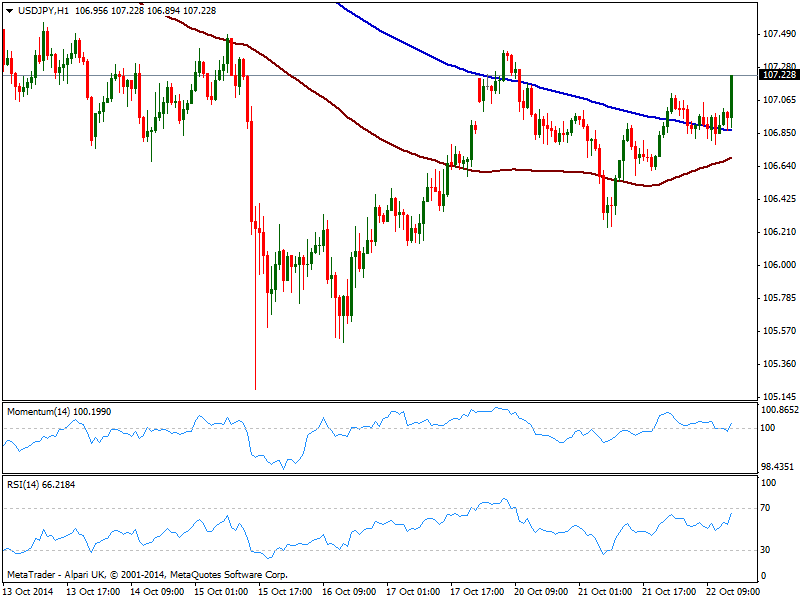
The USD/JPY finally woke up, accelerating higher early US session, and nearing recent highs in the 107.35 price zone, immediate resistance. The 1 hour chart shows price extending above moving averages, as indicators also head higher above their midlines; in the 4 hours chart however, indicators remain in neutral territory, showing no directional strength at the time being. Nevertheless, a break above afore mentioned highs, should lead to a continued advance towards 107.60/70 price zone.
Support levels: 106.95 106.60 106.30
Resistance levels: 107.35 107.60 108.00
AUD/USD Current price: 0.8771
View Live Chart of the AUD/USD
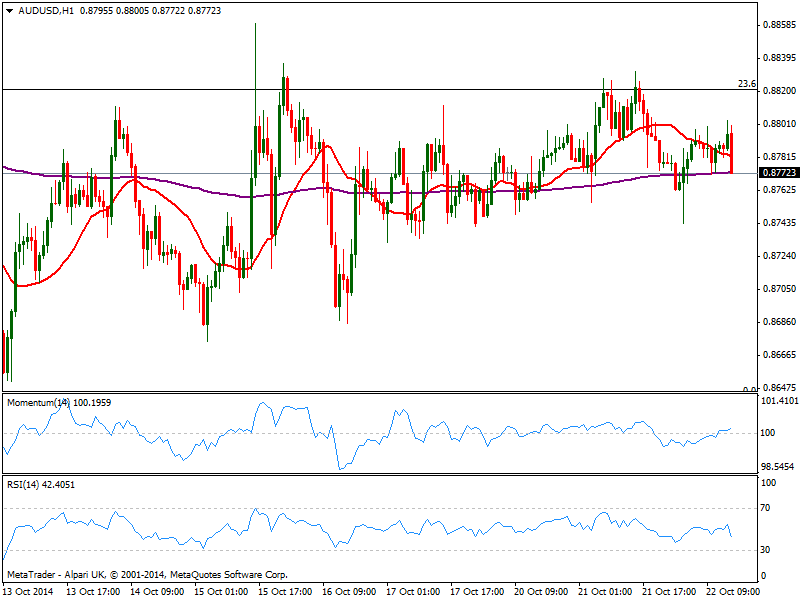
The AUD/USD continues with nothing to offer to intraday traders, confined to a tight range after a short lived slide to 0.8743 following the release of mild weak Australian inflation past Asian session. Current dollar momentum however, sees the pair testing 0.8770 support and indicators in the 1 hour chart with a mild bearish tone, yet overall neutral due to the tight range seen lately. In the 4 hours chart the neutral stance also prevails, and it will take a slide below 0.8730 to confirm a steadier decline for the upcoming hours.
Support levels: 0.8770 0.8730 0.8690
Resistance levels: 0.8820 0.8860 0.8900
Recommended Content
Editors’ Picks
EUR/USD edges lower toward 1.0700 post-US PCE

EUR/USD stays under modest bearish pressure but manages to hold above 1.0700 in the American session on Friday. The US Dollar (USD) gathers strength against its rivals after the stronger-than-forecast PCE inflation data, not allowing the pair to gain traction.
GBP/USD retreats to 1.2500 on renewed USD strength

GBP/USD lost its traction and turned negative on the day near 1.2500. Following the stronger-than-expected PCE inflation readings from the US, the USD stays resilient and makes it difficult for the pair to gather recovery momentum.
Gold struggles to hold above $2,350 following US inflation

Gold turned south and declined toward $2,340, erasing a large portion of its daily gains, as the USD benefited from PCE inflation data. The benchmark 10-year US yield, however, stays in negative territory and helps XAU/USD limit its losses.
Bitcoin Weekly Forecast: BTC’s next breakout could propel it to $80,000 Premium

Bitcoin’s recent price consolidation could be nearing its end as technical indicators and on-chain metrics suggest a potential upward breakout. However, this move would not be straightforward and could punish impatient investors.
Week ahead – Hawkish risk as Fed and NFP on tap, Eurozone data eyed too

Fed meets on Wednesday as US inflation stays elevated. Will Friday’s jobs report bring relief or more angst for the markets? Eurozone flash GDP and CPI numbers in focus for the Euro.