EUR/USD Current price: 1.3177
View Live Chart for the EUR/USD
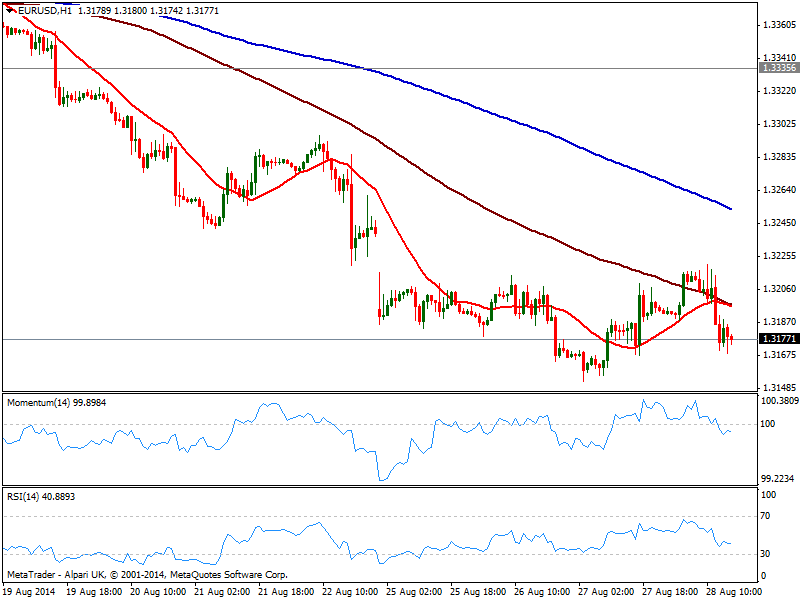
Once again, the EUR/USD retreated from the 1.3210/20 price zone, under pressure early US session after better than expected GDP numbers, revised up to 4.2%. Earlier on the day, safe havens got a boost from news Russia invaded Ukraine, but the movements across the board remain shallow, with majors within latest ranges. Technically, the hourly chart for EUR/USD shows an increasing bearish potential, with indicators heading strongly down into negative territory and price below 20 SMA. In the 4 hours chart price continues to hover back and forth around a flat 20 SMA, with indicators turning lower in neutral territory. A break below 1.3150 should see the pair extending its decline towards the 1.3100 price zone, albeit market is expected to remain on hold, ahead of tomorrow EZ inflation data, and next week Central Bank meeting.
Support levels: 1.3150 1.3120 1.3090
Resistance levels: 1.3215 1.3240 1.3280
GBP/USD Current price: 1.6578
View Live Chart for the GBP/USD
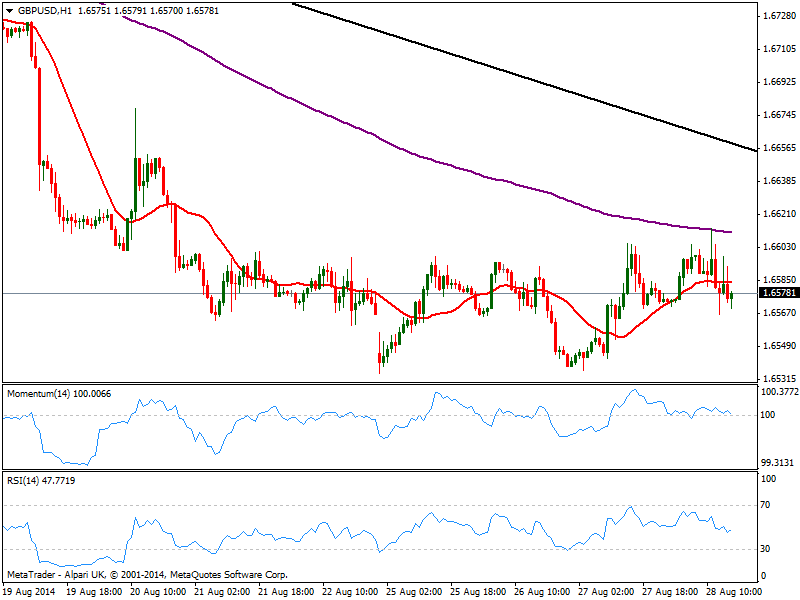
The GBP/USD daily advance stalled at 1.6604, with the pair back to its comfort zone around 1.6570/80 where it stood for most of this week. The hourly chart shows price right below its 20 SMA but indicators still hovering around their midlines, lacking clear direction. In the 4 hours chart the technical picture is also neutral, with some steady advance either above 1.6600 or below 1.6540 required to trigger a clearer directional move.
Support levels: 1.6540 1.6490 1.6465
Resistance levels: 1.6600 1.6630 1.6660
USD/JPY Current price: 103.73
View Live Chart for the USD/JPY
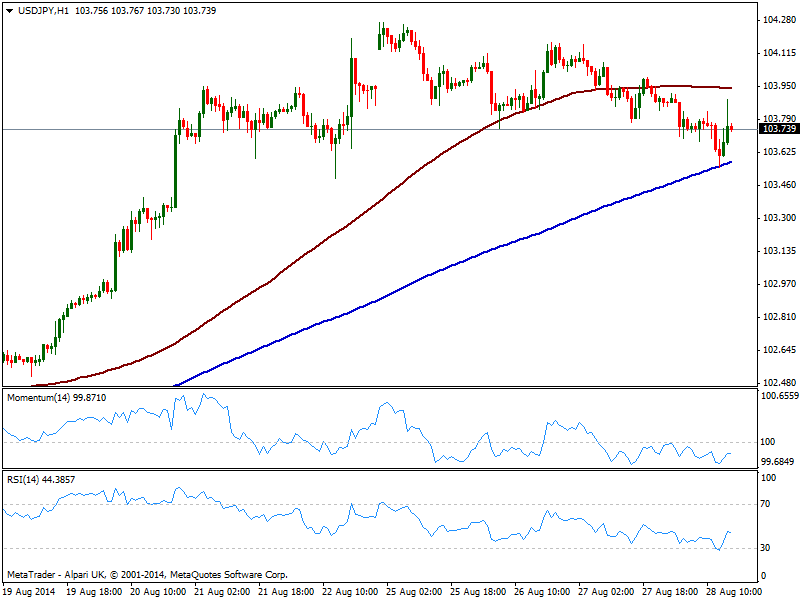
The USD/JPY sees some downward pressure on risk aversion, but the pair found intraday demand at its 200 SMA in the hourly chart currently at 103.55, but remains below 100 one and indicators lose upward potential in negative territory. In the 4 hours chart the technical picture is bearish, with indicators heading south below their midlines, supporting another leg lower in the short term, moreover if local share markets remain under pressure.
Support levels: 103.55 103.20 102.85
Resistance levels: 104.20 104.50 104.80
AUD/USD Current price: 0.9356
View Live Chart for the AUD/USD
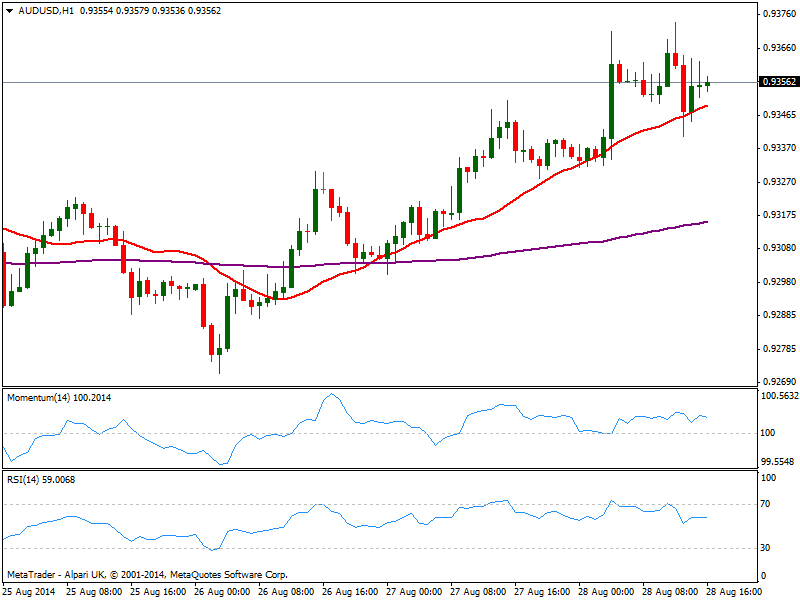
The AUD/USD reached 0.9373 before pulling back, maintaining however a mild bullish tone, as per price steady above 0.9330 immediate support and the hourly chart showing price finding short term support in a mild bullish 20 SMA and indicators in positive territory. In the 4 hours chart indicators are getting exhausted to the upside near overbought levels, yet a downward correction will be subdue to a break below mentioned 0.9330 strong static support.
Support levels: 0.9330 0.9300 0.9260
Resistance levels: 0.9370 0.9410 0.9450
Recommended Content
Editors’ Picks
EUR/USD edges lower toward 1.0700 post-US PCE

EUR/USD stays under modest bearish pressure but manages to hold above 1.0700 in the American session on Friday. The US Dollar (USD) gathers strength against its rivals after the stronger-than-forecast PCE inflation data, not allowing the pair to gain traction.
GBP/USD retreats to 1.2500 on renewed USD strength

GBP/USD lost its traction and turned negative on the day near 1.2500. Following the stronger-than-expected PCE inflation readings from the US, the USD stays resilient and makes it difficult for the pair to gather recovery momentum.
Gold struggles to hold above $2,350 following US inflation

Gold turned south and declined toward $2,340, erasing a large portion of its daily gains, as the USD benefited from PCE inflation data. The benchmark 10-year US yield, however, stays in negative territory and helps XAU/USD limit its losses.
Bitcoin Weekly Forecast: BTC’s next breakout could propel it to $80,000 Premium

Bitcoin’s recent price consolidation could be nearing its end as technical indicators and on-chain metrics suggest a potential upward breakout. However, this move would not be straightforward and could punish impatient investors.
Week ahead – Hawkish risk as Fed and NFP on tap, Eurozone data eyed too

Fed meets on Wednesday as US inflation stays elevated. Will Friday’s jobs report bring relief or more angst for the markets? Eurozone flash GDP and CPI numbers in focus for the Euro.