EUR/USD Current price: 1.3368
View Live Chart for the EUR/USD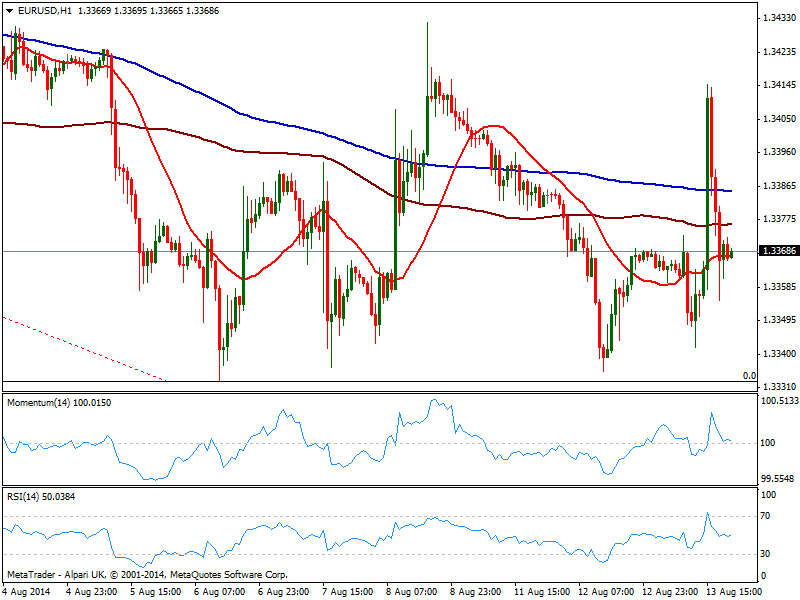
The EUR/USD traded within a 70 pips range this Wednesday, down to 1.3342 early Europe on the back of weak EZ industrial production data, advancing suddenly up to 1.3414 on disappointing US Retail Sales, fat on July. But at the end of the day the pair stands right where it started, with investors now setting aside ahead of European GDP final readings early Thursday. Technically, the strong intraday advance has barely affected the wider picture, as price stalled below 1.3430/40 area, level that capped the upside for almost 3 weeks already.
The hourly chart shows price closing the day below its moving averages, while indicators approach their midlines, having erased all of their overbought readings. In the 4 hours chart indicators retrace from their midlines extending into bearish territory, as latest candle opened below a flat 20 SMA. As long as below mentioned 1.3430/40 area, the upside will remain limited, while a break below 1.3330 lows should trigger stops and therefore fuel the dominant bearish trend.
Support levels: 1.3330 1.3295 1.3250
Resistance levels: 1.3400 1.3440 1.3485
EUR/JPY Current price: 136.98
View Live Chart for the EUR/JPY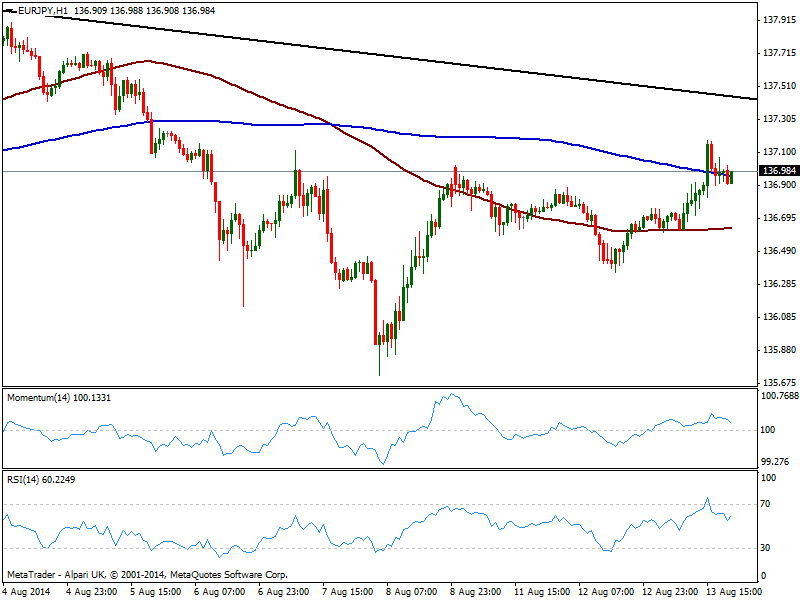
The Japanese yen suffered all through this Wednesday, down on weak Japanese GDP readings, and helped by recovering stocks across the world. The EUR/JPY advanced up to 137.18 before pulling back below the 137.00 figure, with the hourly chart showing indicators losing upward strength but holding in positive territory, as price struggles around a bearish 200 SMA. In the 4 hours chart the upside seems more constructive, yet the bullish momentum also eases some. A daily descendant trend line coming from May high of 142.36 stands today in the 137.50 area and it would take a recovery above it to support a continued advance towards 138.00/20 price zone.
Support levels: 136.60 136.20 135.70
Resistance levels: 137.10 137.50 137.90
GBP/USD Current price: 1.6689
View Live Chart for the GBP/USD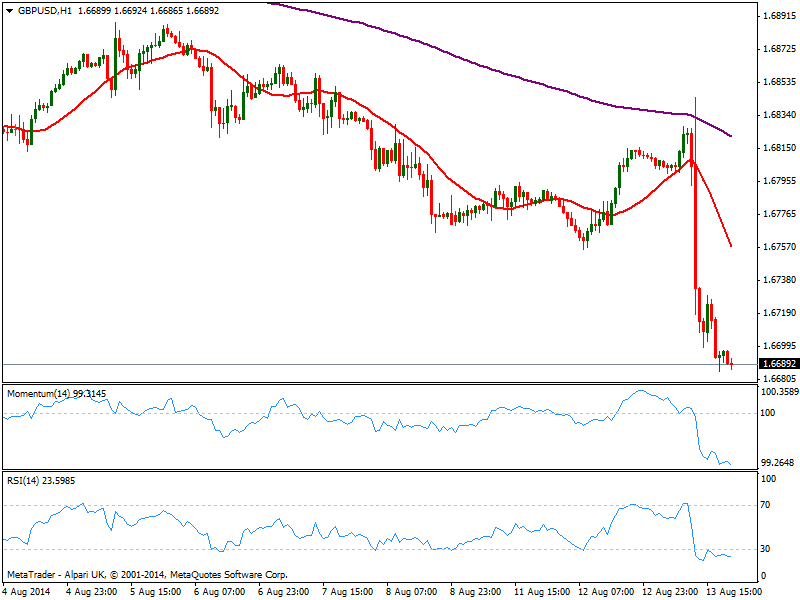
Pound had one of its worse days of the year, shedding near 150 pips against the dollar on UK fundamental data: employment figures missed expectations with wages down, while quarterly inflation report ended up with a dovish BOE’s governor Carney, concerned about the slack economy and diminishing chances of a sooner rate hike: the GBP/USD fell down to 1.6700 with the news, finally breaking below 1.6695 area where it stands. The hourly chart shows indicators still heading lower despite in extreme oversold levels, while 20 SMA turned strongly south, offering now dynamic resistance in the 1.6760 price zone. In the 4 hours chart the picture is also strongly bearish, supporting fresh lows ahead as long as mentioned resistance holds.
Support levels: 1.6650 1.6620 1.6580
Resistance levels: 1.6695 1.6730 1.6760
USD/JPY Current price: 102.44
View Live Chart for the USD/JPY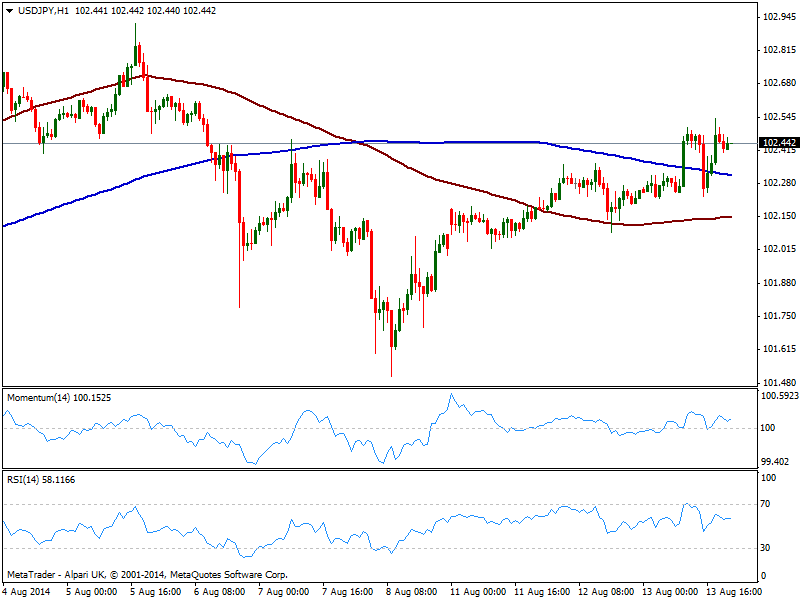
The USD/JPY holds near its daily high of 102.54, slightly firmer on the day, but showing no actual strength at the time being. The hourly chart shows price standing above 100 and 200 SMAs with this last now offering dynamic support around 102.30; indicators in the same time frame had lost their upward tone but hold above their midlines, while the 4 hours chart presents a positive tone coming from technical readings, that supports a test of 102.80 immediate resistance.
Support levels: 102.30 101.95 101.60
Resistance levels: 102.80 103.10 103.45
AUD/USD Current price: 0.9304
View Live Chart for the AUD/USD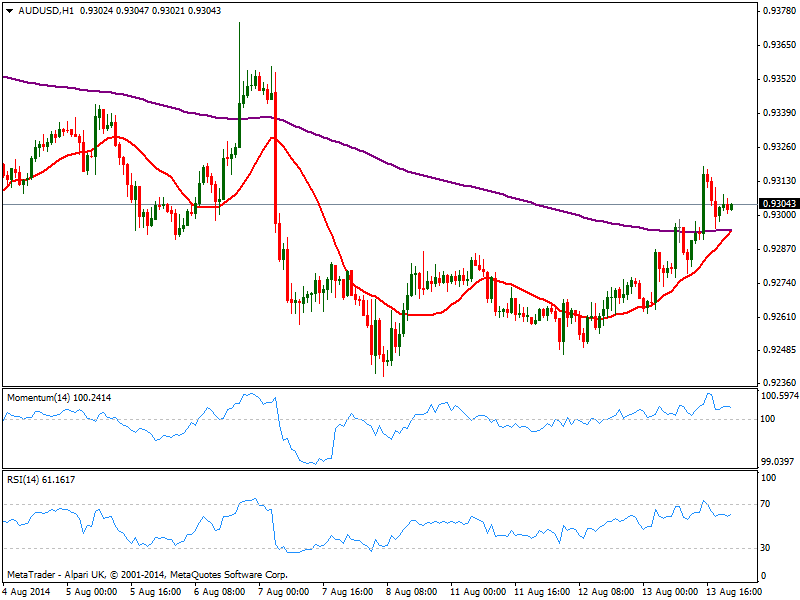
The AUD/USD stands above the 0.9300 figure, boosted by negative US data. Having advanced up to 0.9318, the critical resistance remains at 0.9330, and further advances will depend on the ability of price to break above it. Technically the hourly chart shows 20 SMA heading strongly up below current level, while indicators turned flat in positive territory due to the latest short term range. In the 4 hours chart the pair maintains a positive tone with risk of a downward movement increasing on a break below 0.9290 immediate short term support.
Support levels: 0.9290 0.9260 0.9220
Resistance levels: 0.9330 0.9370 0.9410
Recommended Content
Editors’ Picks
EUR/USD edges lower toward 1.0700 post-US PCE

EUR/USD stays under modest bearish pressure but manages to hold above 1.0700 in the American session on Friday. The US Dollar (USD) gathers strength against its rivals after the stronger-than-forecast PCE inflation data, not allowing the pair to gain traction.
GBP/USD retreats to 1.2500 on renewed USD strength

GBP/USD lost its traction and turned negative on the day near 1.2500. Following the stronger-than-expected PCE inflation readings from the US, the USD stays resilient and makes it difficult for the pair to gather recovery momentum.
Gold struggles to hold above $2,350 following US inflation

Gold turned south and declined toward $2,340, erasing a large portion of its daily gains, as the USD benefited from PCE inflation data. The benchmark 10-year US yield, however, stays in negative territory and helps XAU/USD limit its losses.
Bitcoin Weekly Forecast: BTC’s next breakout could propel it to $80,000 Premium

Bitcoin’s recent price consolidation could be nearing its end as technical indicators and on-chain metrics suggest a potential upward breakout. However, this move would not be straightforward and could punish impatient investors.
Week ahead – Hawkish risk as Fed and NFP on tap, Eurozone data eyed too

Fed meets on Wednesday as US inflation stays elevated. Will Friday’s jobs report bring relief or more angst for the markets? Eurozone flash GDP and CPI numbers in focus for the Euro.