EUR/USD Current price: 1.3368
View Live Chart for the EUR/USD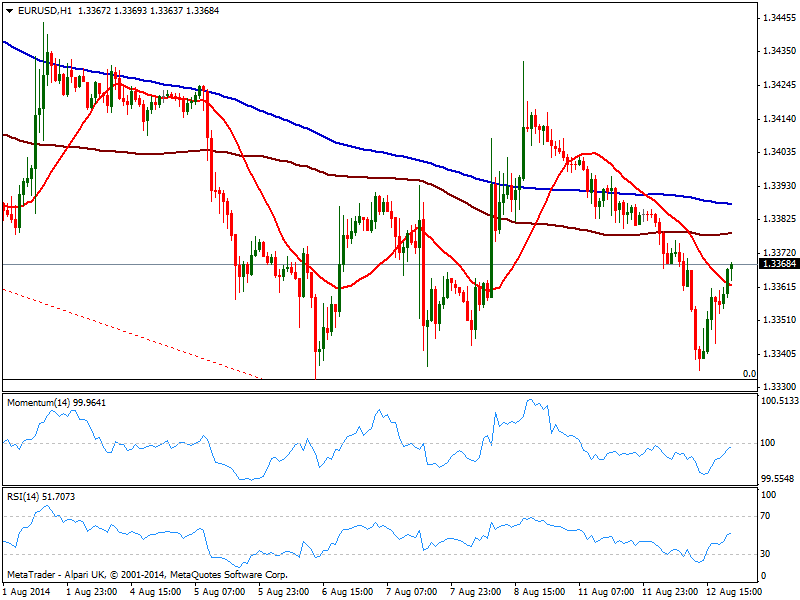
Dollar edged lower against most rivals in a livelier trading journey, still limited by the typical summer drop in volume. But there was an exception to dollar intraday weakness, and of course it came from the EUR: the pair retested the year low falling down to 1.3335 on the back of disappointing German data early Europe, and despite a late bounce, it was not enough to push price back to positive territory.
Short term, the technical picture is showing price advancing at it session highs above a bearish 20 SMA, while indicators approach their midlines, still below them which means upward momentum is not enough to confirm a bullish continuation; in the same time frame 100 and 200 SMAs stand well above current price, suggesting the main interest is to the downside. In the 4 hours chart technical readings maintain the negative tone, with momentum heading south below its midline and price capped by 20 SMA now around 1.3370. The large amount of shorts has turned risky to sell on break lowers, as there’s a chance there won’t be follow through afterwards, so waiting for upward corrections continue to be the most wise choice.
Support levels: 1.3330 1.3295 1.3250
Resistance levels: 1.3370 1.3410 1.3450
EUR/JPY Current price: 136.64
View Live Chart for the EUR/JPY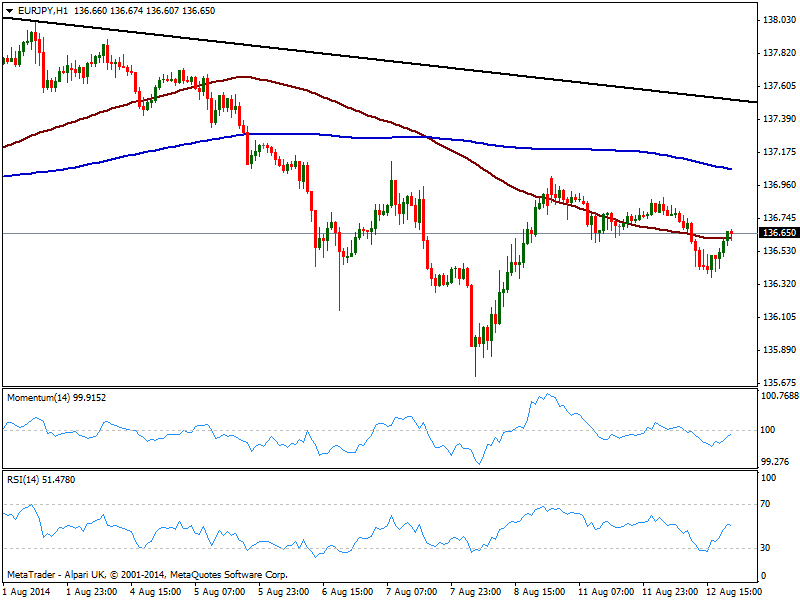
The EUR/JPY eased down to 136.36 before bouncing some back, maintaining the overall bearish tone as per posting a lower low daily basis. The hourly chart shows price right around its 100 SMA that maintains a bearish slope, with 200 one around 137.10, reinforcing the strength of the static resistance area. In the same time frame, indicators are losing their upward strength below their midlines, meaning if price fails to extend its advance, further slide are in the scheme. In the 4 hours chart technical readings present a neutral stance adding not much to the shorter term one. At this point, a break below 136.20 is required then to confirm a downward continuation, eyeing a retest of last week low of 135.72.
Support levels: 136.60 136.20 135.70.
Resistance levels: 137.10 137.50 137.90
GBP/USD Current price: 1.6810
View Live Chart for the GBP/USD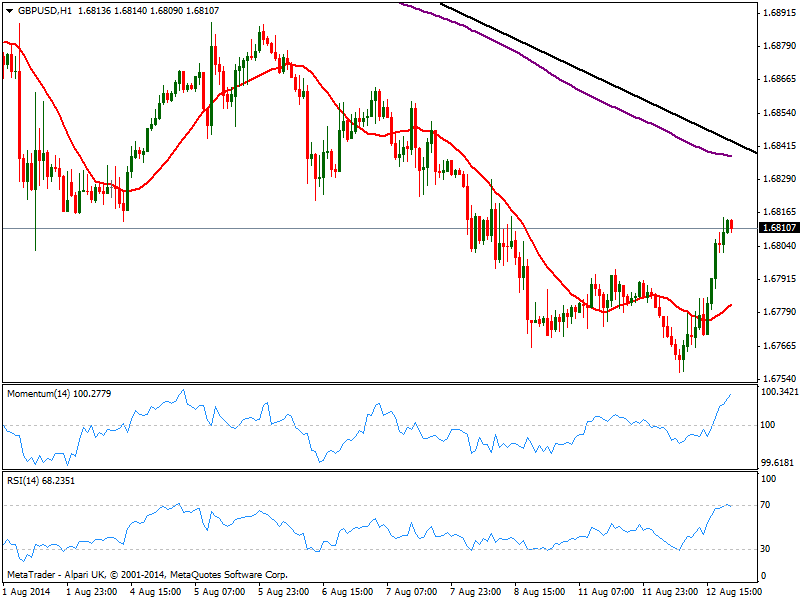
Pound surged above 1.6800 against the greenback, closing the day around its high of 1.6815. With little behind the movement, market players are eagerly waiting for Wednesday employment data and UK inflation report, which no doubts will be critical for the pairs trend, moreover if both converge: an improvement in the jobs sector along with a more hawkish tone from Carney is what it takes to see the GBP/USD regaining the upside. Technically, the hourly chart shows momentum still strong albeit RSI starting to get exhausted in overbought territory, while 20 SMA heads higher below current price. In the 4 hours chart the technical view is also positive, with indicators crossing their midlines to the upside, and price holding above its 20 SMA. Still, the daily descendant trend line coming from its year high stands in the way around 1.6840, and it will be above it that the bullish path will become clearer.
Support levels: 1.6770 1.6730 1.6695
Resistance levels: 1.6840 1.6885 1.6920
USD/JPY Current price: 102.21
View Live Chart for the USD/JPY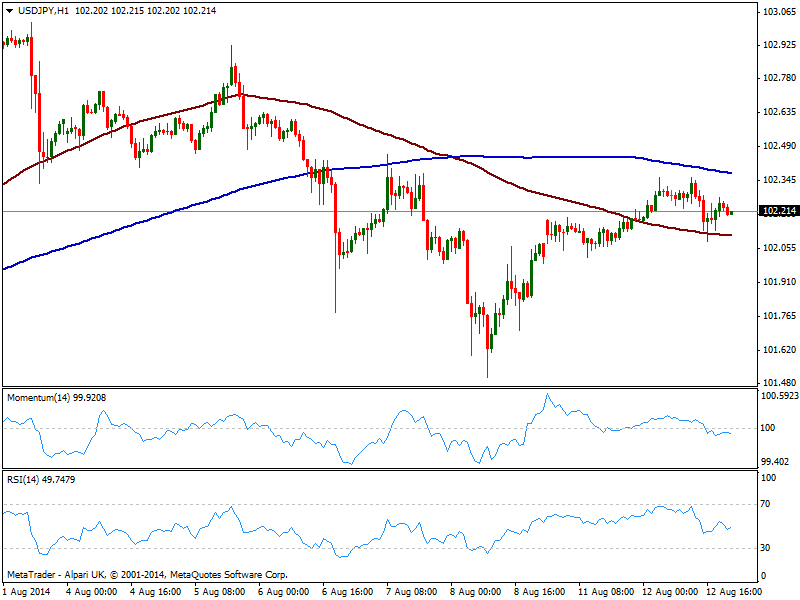
The USD/JPY advance failed to overcome 102.30/40 static resistance area, having retraced some from a daily high of 102.36. Ahead of Asian opening, the hourly chart shows price between 100 and 200 SMAs, with indicators slightly lower in neutral territory, showing no actual directional strength. In the 4 hours chart however, the picture is more upside constructive, with momentum still heading north in positive territory. Levels to watch for the upcoming sessions are 101.95 to the downside, and mentioned 102.40 area to the upside, as it will take a clear break of any to see some directional move.
Support levels: 101.95 101.60 101.20
Resistance levels: 102.35 102.80 103.10
AUD/USD Current price: 0.9274
View Live Chart for the AUD/USD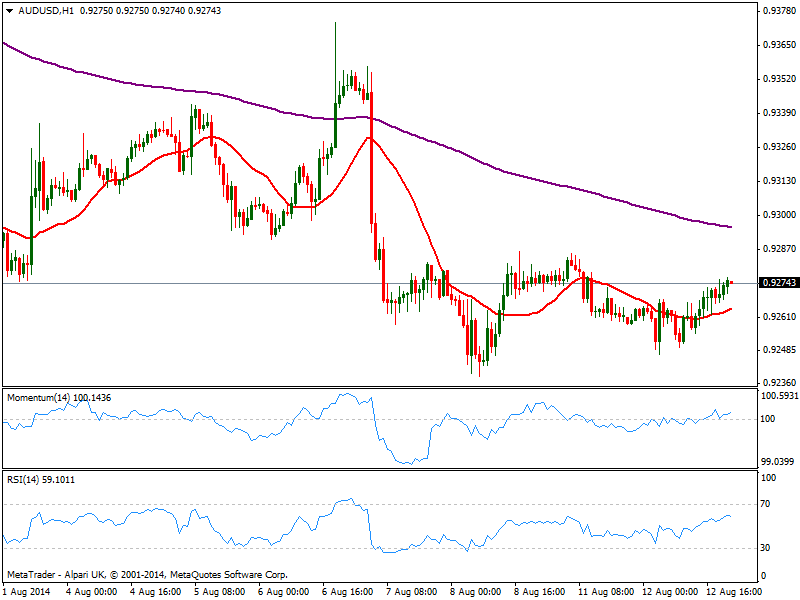
The AUD/USD stayed on hold, adding barely 15 pips on the day. Asian session will bring some minor Australian data along with more interesting Chinese one, these last, with more chances of affecting the pair. At this point, the short term technical picture is mildly positive, with price above its 20 SMA and indicators above their midlines, although showing no current strength. In the 4 hours chart the picture is not that clear, with indicators losing upward potential above their midlines. The 0.9330 resistance is the key level to watch to the upside, as it will take steady gains above it to shrug off some of current bearishness, at least in the short term.
Support levels: 0.9260 0.9220 0.9180
Resistance levels: 0.9290 0.9330 0.9370
Recommended Content
Editors’ Picks
EUR/USD edges lower toward 1.0700 post-US PCE

EUR/USD stays under modest bearish pressure but manages to hold above 1.0700 in the American session on Friday. The US Dollar (USD) gathers strength against its rivals after the stronger-than-forecast PCE inflation data, not allowing the pair to gain traction.
GBP/USD retreats to 1.2500 on renewed USD strength

GBP/USD lost its traction and turned negative on the day near 1.2500. Following the stronger-than-expected PCE inflation readings from the US, the USD stays resilient and makes it difficult for the pair to gather recovery momentum.
Gold struggles to hold above $2,350 following US inflation

Gold turned south and declined toward $2,340, erasing a large portion of its daily gains, as the USD benefited from PCE inflation data. The benchmark 10-year US yield, however, stays in negative territory and helps XAU/USD limit its losses.
Bitcoin Weekly Forecast: BTC’s next breakout could propel it to $80,000 Premium

Bitcoin’s recent price consolidation could be nearing its end as technical indicators and on-chain metrics suggest a potential upward breakout. However, this move would not be straightforward and could punish impatient investors.
Week ahead – Hawkish risk as Fed and NFP on tap, Eurozone data eyed too

Fed meets on Wednesday as US inflation stays elevated. Will Friday’s jobs report bring relief or more angst for the markets? Eurozone flash GDP and CPI numbers in focus for the Euro.