EUR/USD Current price: 1.3381
View Live Chart for the EUR/USD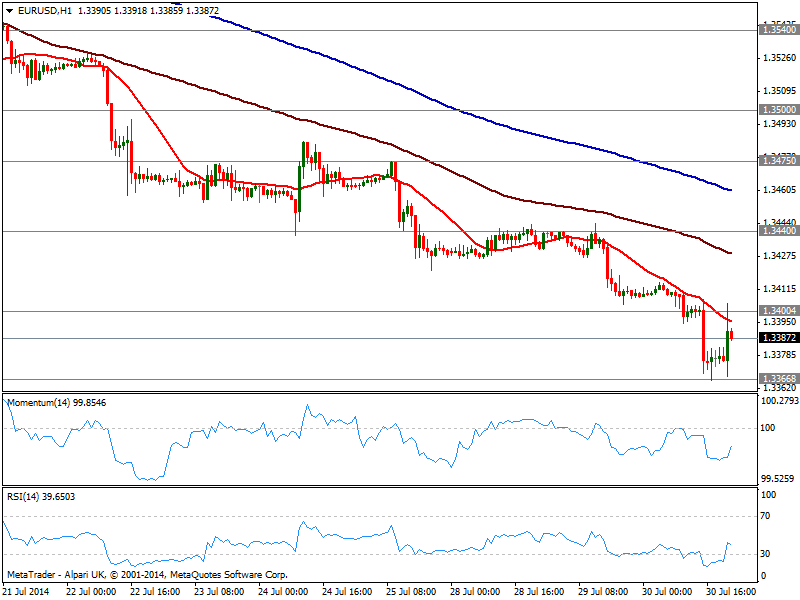
It was a day like not seen in long in the forex world, with the calendar fulfilled with data and majors actually moving more than 20 pips on it. First round of macro releases started with an in line with expected German inflation, a mild weak US ADP employment survey, and a strong US GDP reading, probably the most relevant event of the day. US economy shown an impressive 4.0% growth in the second quarter, compared to first one finally revised up to -2.1%. The EUR/USD sunk to a fresh year low of 1.3367 on the news, where it held until FOMC: the US Central Bank surprised no one with a $10B taper and a tiny changed to the wording in its statement over employment situation concerns that resulted in a downward correction for the greenback across the board.
As for the EUR/USD, latest rally was contained by sellers in the 1.3400 area with the hourly chart showing price unable to open a candle above a still bearish 20 SMA and indicators just correcting extreme oversold readings accomplished earlier on the day. In the 4 hours chart momentum maintains a strong bearish tone, while RSI stands around 30 still trying to correct higher. Overall, the downside remains favored, with a break below the daily low exposing 1.3295, November 2013 monthly low.
Support levels: 1.3370 1.3335 1.3295
Resistance levels: 1.3405 1.3440 1.3475
EUR/JPY Current price: 137.70
View Live Chart for the EUR/JPY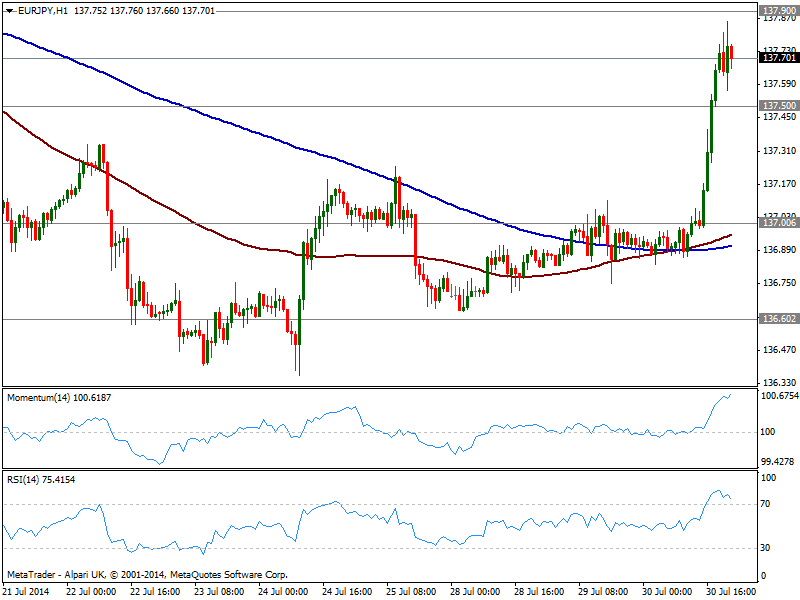
Yen crosses were on the losing side for most of the day, despite stocks traded in red along with falling yen, more due probably to weak Japanese numbers, with Retail sales down and unemployment up. FED saved the day among stocks traders, as US indexed trimmed most of their intraday losses, giving support to the falling yen. As for the EUR/JPY, the pair extended up to 137.85 before halting the rally, consolidating now above 137.50 immediate support. The hourly chart shows a strong bullish tone coming from indicators that stand in overbought levels, with moving averages converging right below the 137.00 mark. In the 4 hours chart momentum heads strongly north while RSI losses upward potential in overbought levels, suggesting at least a pause in current bullish run. Further gains need to extend above 137.90 to confirm an upward continuation towards critical 138.40 area, not that easy to accomplish considering EUR self weakness. A break below 137.50 on the other hand, will put the pair back on the bearish side, eyeing a retest of 136.90/137.00 price zone.
Support levels: 137.50 137.90 136.60
Resistance levels: 137.90 138.40 138.85
GBP/USD Current price: 1.6906
View Live Chart for the GBP/USD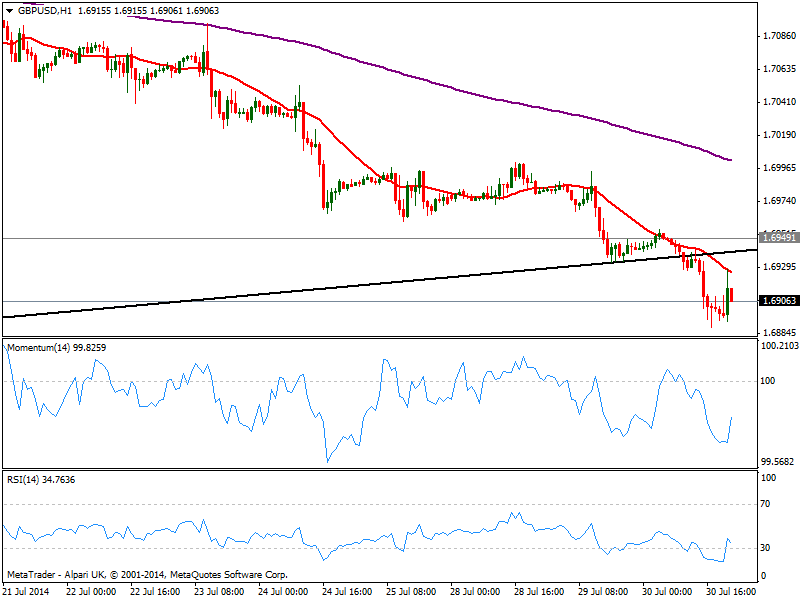
The GBP/USD continued correcting lower, down to 1.6889 for a brief moment, as the pair recovered quickly above the 1.6900 mark, showing not that much bearish interest at current levels. The hourly chart shows price below a daily ascendant trend line coming from October last year currently around 1.6950 and immediate resistance level, while indicators correct oversold readings, but price remains contained below a bearish 20 SMA. In the 4 hours chart the pair maintains a strong bearish tone that should keep the upside limited, with a break below 1.6890 suggesting further slides in Pound.
Support levels: 1.6890 1.6850 1.6815
Resistance levels: 1.6950 1.7000 1.7045
USD/JPY Current price: 102.86
View Live Chart for the USD/JPY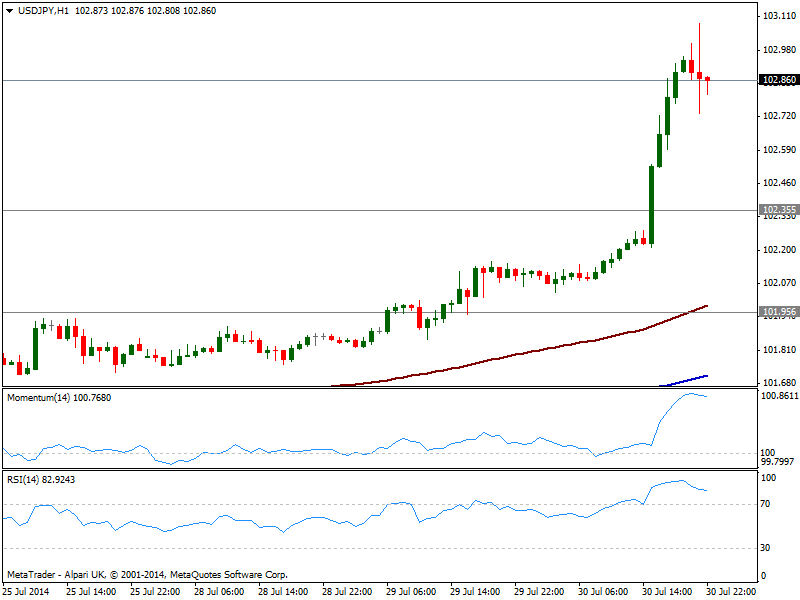
The USD/JPY trades at levels not seen since early May, having spiked up to 103.08 before pulling back some. Technically, the hourly chart shows indicators turning lower in extreme overbought levels, not surprising considering the pair has been rising steadily for 2 weeks in a row. In the 4 hours chart momentum continues to advance while RSI eases some, both far from suggesting a stronger bearish move. Downside corrections towards 102.35 won’t really affect the trend, and buyers will probably surge on approaches to the level, albeit for the most, some consolidation is expected until Friday’s NFP data.
Support levels: 102.80 102.35 101.95
Resistance levels: 103.10 103.40 103.80
AUD/USD Current price: 0.9331
View Live Chart for the AUD/USD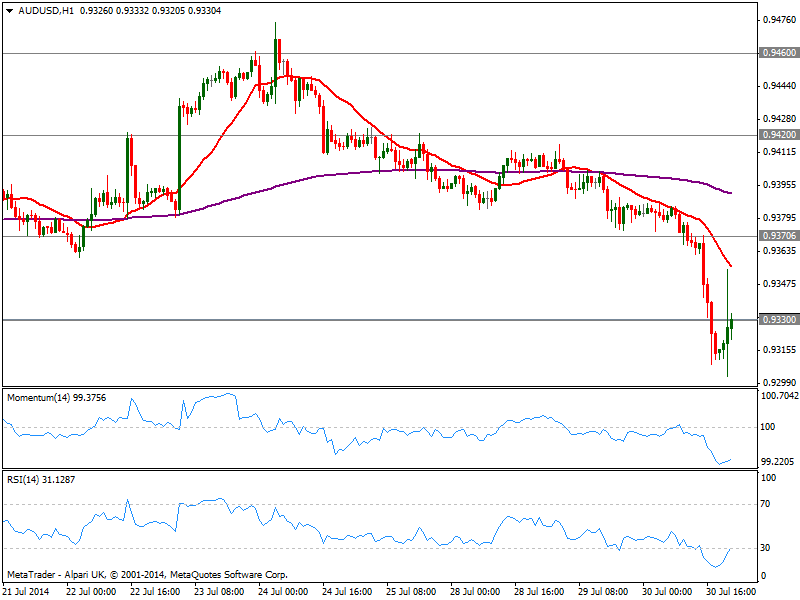
After falling as low as 0.9302, the AUD/USD is having a hard time to regain 0.9330 former critical support area that contained the downside during the last 2 months. The hourly chart shows 20 SMA turning strongly south capping latest upward spike, and indicators aiming to correct higher from oversold levels. In the 4 hours chart price accelerated below 200 EMA that converges with 20 SMA around 0.9380, while momentum maintains a strong bearish slope: if the pair fails to regain current 0.9330 price zone, the downside is exposed towards 0.9260 strong midterm support, while upward correction will face now selling interest around 0.9370 static resistance zone.
Support levels: 0.9300 0.9260 0.9220
Resistance levels: 0.9370 0.9420 0.9460
Recommended Content
Editors’ Picks
EUR/USD edges lower toward 1.0700 post-US PCE

EUR/USD stays under modest bearish pressure but manages to hold above 1.0700 in the American session on Friday. The US Dollar (USD) gathers strength against its rivals after the stronger-than-forecast PCE inflation data, not allowing the pair to gain traction.
GBP/USD retreats to 1.2500 on renewed USD strength

GBP/USD lost its traction and turned negative on the day near 1.2500. Following the stronger-than-expected PCE inflation readings from the US, the USD stays resilient and makes it difficult for the pair to gather recovery momentum.
Gold struggles to hold above $2,350 following US inflation

Gold turned south and declined toward $2,340, erasing a large portion of its daily gains, as the USD benefited from PCE inflation data. The benchmark 10-year US yield, however, stays in negative territory and helps XAU/USD limit its losses.
Bitcoin Weekly Forecast: BTC’s next breakout could propel it to $80,000 Premium

Bitcoin’s recent price consolidation could be nearing its end as technical indicators and on-chain metrics suggest a potential upward breakout. However, this move would not be straightforward and could punish impatient investors.
Week ahead – Hawkish risk as Fed and NFP on tap, Eurozone data eyed too

Fed meets on Wednesday as US inflation stays elevated. Will Friday’s jobs report bring relief or more angst for the markets? Eurozone flash GDP and CPI numbers in focus for the Euro.