EUR/USD Current price: 1.3697
View Live Chart for the EUR/USD
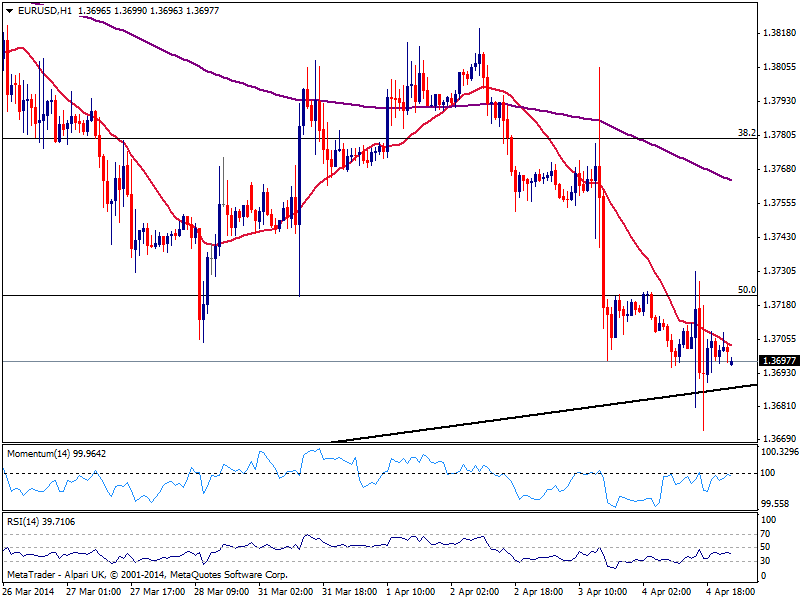
With no difference from Friday’s close, the EUR/USD trades a few pips above the 5-week low posted at 1.3672. The combination of a dovish ECB with a not that bad US employment report, has left the pair tumbling around a major support area around 1.3660.Technically, the short term picture is bearish, with price capped below a bearish 20 SMA and indicators heading lower below their midlines, albeit some downward acceleration is required to confirm a red Monday. In the 4 hours chart indicators also present a negative tone, with a daily ascendant trend line coming from 1.2755 at 1.3680, and the 61.8% retracement of the latest bullish run around 1.3660. A break below this last should trigger stops and therefore the bearish momentum in the pair eyeing then for a test of the 1.3600 area.
Support levels: 1.3680 1.3650 1.3610
Resistance levels: 1.3725 1.3750 1.3780
EUR/JPY Current price: 141.45
View Live Chart for the EUR/JPY
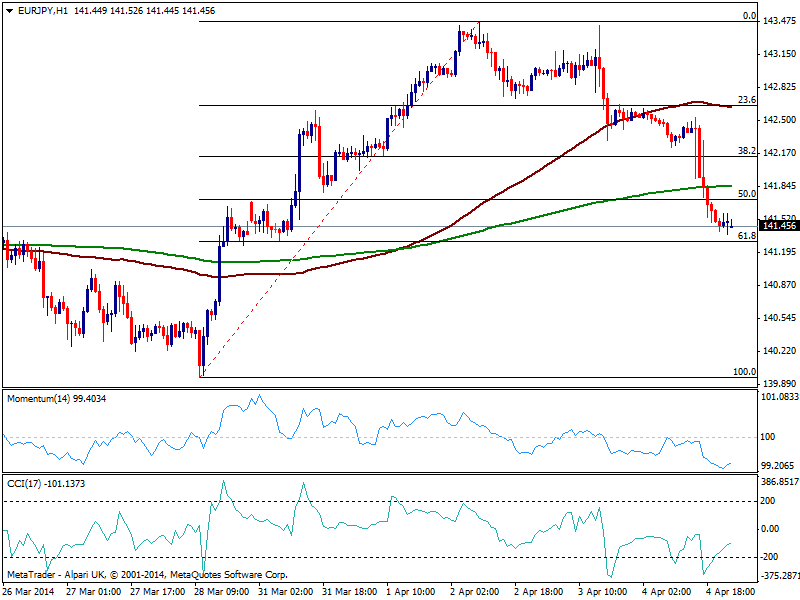
Yen gained the most with US Payroll numbers and local stocks nose diving, leaving the EUR/JPY with an increased short term bearish potential, according to the hourly chart: price broke below its moving averages, while indicators head slightly higher correcting oversold readings rather than suggesting a comeback. In the 4 hours chart indicators maintain a strong bearish tone, while price hovers a few pips above the 61.8% retracement of the latest bullish run at 141.30. A break below this last should signal a bearish continuation, eyeing 140.40 strong static support area, in route to 139.90 price zone.
Support levels: 141.30 140.80 140.40
Resistance levels: 141.70 142.60 143.10
GBP/USD Current price: 1.6575
View Live Chart for the GBP/USD
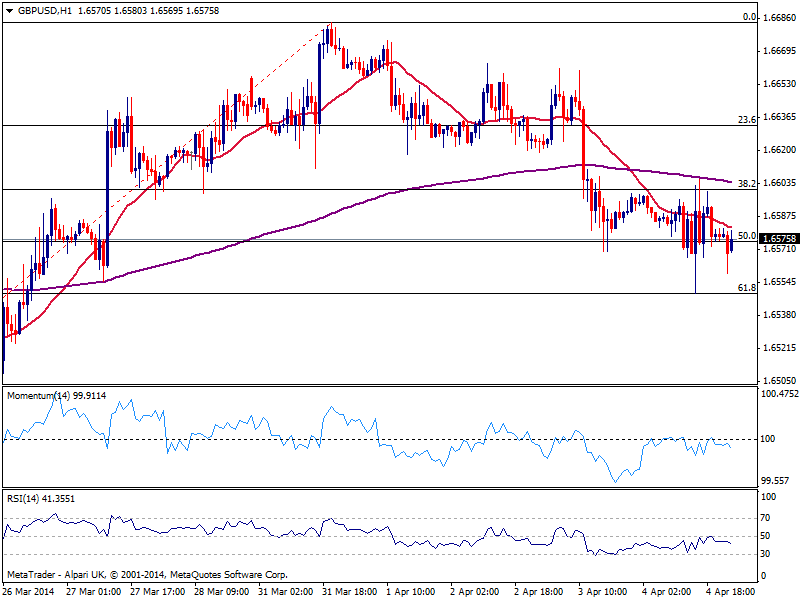
Pound eased down to 1.6549 against the greenback last Friday, finding support by the pip in the 61.8% retracement of its latest bullish run, albeit the afterwards bounce has been limited: the hourly chart shows price below a bearish 20 SMA offering dynamic resistance around 1.6580 in the short term, while indicators turn lower, retracing from their midlines. In the 4 hours chart indicators present a strong bearish momentum, with a break below mentioned support required to confirm a leg lower, probably looking for a test of 1.6470. Steady gains above 1.6610 on the other hand, will support a bullish extension towards the 1.6650 price zone.
Support levels: 1.6550 1.6510 1.6470
Resistance levels: 1.6580 1.6610 1.6650
USD/JPY Current price: 103.39
View Live Chart for the USD/JPY
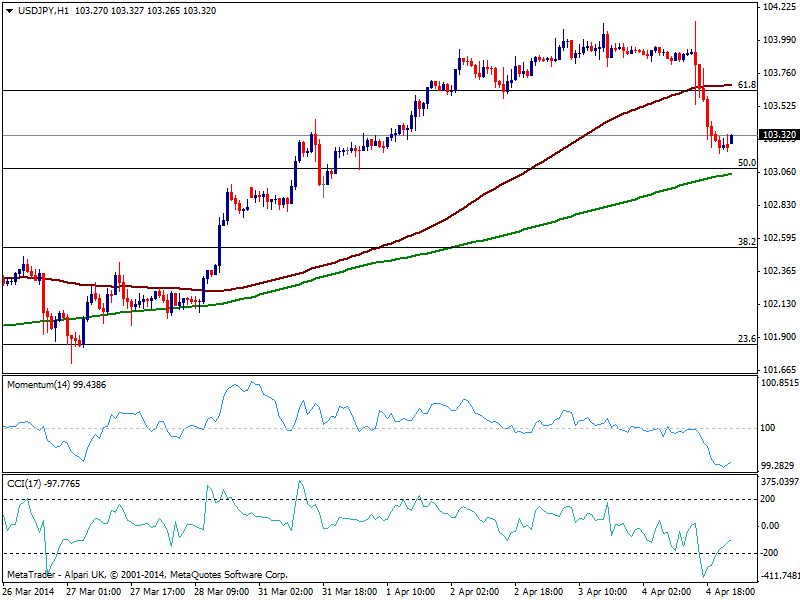
The USD/JPY tries to recover ground this Monday having held above the 103.00 figure. After faltering around the 104.00 area, the pair finally capitulated, and stands well below a strong resistance area in the short term around 103.60, where the hourly chart shows a Fibonacci level converging with the 100 SMA. Indicators in the same time frame pull higher from oversold levels, while the 4 hours chart maintains a technical bearish bias. Some consolidation in between 103.00 and 103.60 should be a expected while a breach on any extreme will determinate upcoming movements in the pair.
Support levels: 103.00 102.60 102.20
Resistance levels: 103.60 104.10 104.45
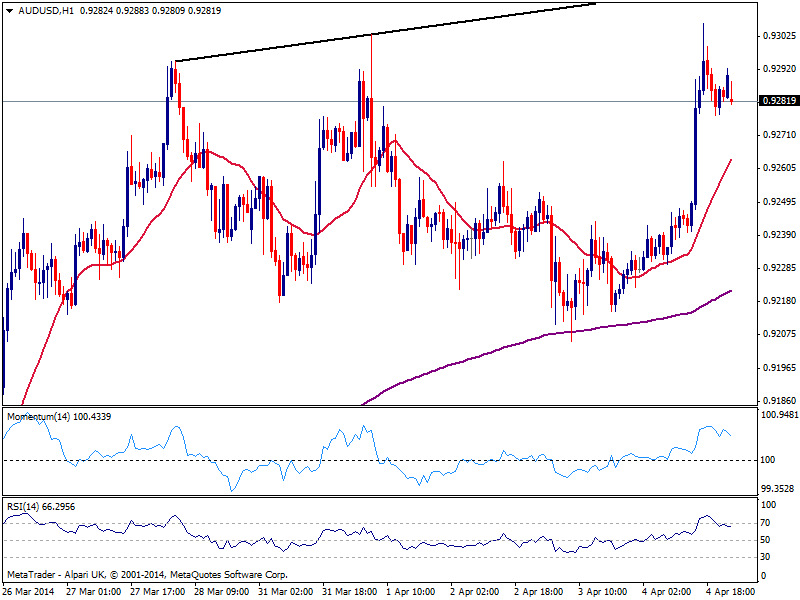
AUD/USD Current price: 0.9281
View Live Chart for the AUD/USD
Australian dollar is again having trouble to take over the 0.9300 level against the greenback, starting the week with the hourly chart showing indicators correcting overbought readings and price firm above a bullish 20 SMA. Despite the lack of follow through, the risk remains to the upside in the pair, as there’s nothing suggesting a top has been formed. In the 4 hours chart indicators also look exhausted to the upside, buy hold in positive territory, suggesting a probable downward correction if 0.9260 immediate support gives up.
Support levels: 0.9260 0.9220 0.9170
Resistance levels: 0.9300 0.9345 0.9390
Recommended Content
Editors’ Picks
EUR/USD holds below 1.0750 ahead of key US data

EUR/USD trades in a tight range below 1.0750 in the European session on Friday. The US Dollar struggles to gather strength ahead of key PCE Price Index data, the Fed's preferred gauge of inflation, and helps the pair hold its ground.
GBP/USD consolidates above 1.2500, eyes on US PCE data

GBP/USD fluctuates at around 1.2500 in the European session on Friday following the three-day rebound. The PCE inflation data for March will be watched closely by market participants later in the day.
Gold clings to modest daily gains at around $2,350

Gold stays in positive territory at around $2,350 after closing in positive territory on Thursday. The benchmark 10-year US Treasury bond yield edges lower ahead of US PCE Price Index data, allowing XAU/USD to stretch higher.
Bitcoin Weekly Forecast: BTC’s next breakout could propel it to $80,000 Premium

Bitcoin’s recent price consolidation could be nearing its end as technical indicators and on-chain metrics suggest a potential upward breakout. However, this move would not be straightforward and could punish impatient investors.
US core PCE inflation set to signal firm price pressures as markets delay Federal Reserve rate cut bets

The core PCE Price Index, which excludes volatile food and energy prices, is seen as the more influential measure of inflation in terms of Fed positioning. The index is forecast to rise 0.3% on a monthly basis in March, matching February’s increase.
