![]()
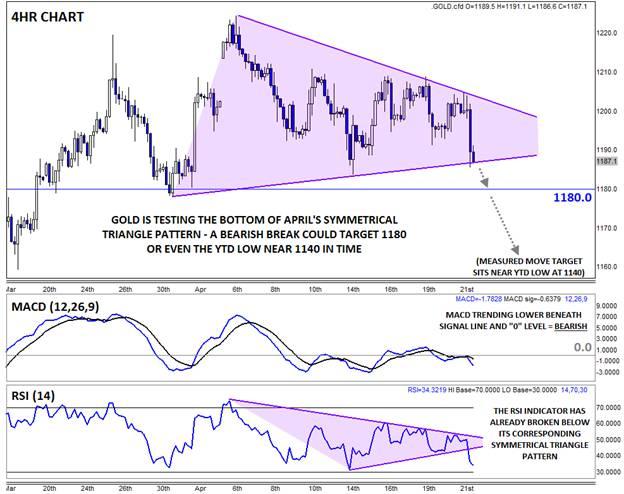
It’s been a very quiet couple of weeks for gold bears, with the yellow metal merely marking time around the 1200 level since the start of the month. Since April Fool’s Day, gold has traded as low as 1180 and as high as 1220, but the trading range has been contracting, creating a clear symmetrical triangle pattern on the 4hr chart. As we’ve noted before, this pattern is analogous to a person compressing a coiled spring: as the range continues to contract, energy builds up within the spring. When one of the pressure points is eventually removed, the spring will explode in that direction. The metal is testing the bottom of the pattern today as a stronger-than-expected US housing report and rising stocks dampens demand for the safe-haven asset.
While it’s notoriously difficult to predict the direction of a symmetrical triangle breakout in advance, technical oscillators can often help tilt the scales in one direction or another. In this case, the RSI indicator recently broke out to the downside of its corresponding symmetrical triangle, providing a possible leading indicator of a bearish breakdown in gold itself. The 4hr MACD is also trending down beneath its signal line and the “0” level, showing a shift to bearish momentum.
As we go to press, gold is testing the bottom of its triangle pattern near 1186, but if that level is conclusively broken, a quick move down to 1180 is in play later this week. From a longer-term perspective, a breakdown from the triangle would suggest a measured move objective all the way down to the year-to-date low at 1140. Of course, gold may still manage to bounce from the bottom of its triangle today, but unless we see a bullish breakout above resistance at 1200, the odds favor an awakening for the bears that have been hibernating throughout the first three weeks of April.

Source: FOREX.com
Information on these pages contains forward-looking statements that involve risks and uncertainties. Markets and instruments profiled on this page are for informational purposes only and should not in any way come across as a recommendation to buy or sell in these assets. You should do your own thorough research before making any investment decisions. FXStreet does not in any way guarantee that this information is free from mistakes, errors, or material misstatements. It also does not guarantee that this information is of a timely nature. Investing in Open Markets involves a great deal of risk, including the loss of all or a portion of your investment, as well as emotional distress. All risks, losses and costs associated with investing, including total loss of principal, are your responsibility. The views and opinions expressed in this article are those of the authors and do not necessarily reflect the official policy or position of FXStreet nor its advertisers. The author will not be held responsible for information that is found at the end of links posted on this page.
If not otherwise explicitly mentioned in the body of the article, at the time of writing, the author has no position in any stock mentioned in this article and no business relationship with any company mentioned. The author has not received compensation for writing this article, other than from FXStreet.
FXStreet and the author do not provide personalized recommendations. The author makes no representations as to the accuracy, completeness, or suitability of this information. FXStreet and the author will not be liable for any errors, omissions or any losses, injuries or damages arising from this information and its display or use. Errors and omissions excepted.
The author and FXStreet are not registered investment advisors and nothing in this article is intended to be investment advice.
Recommended Content
Editors’ Picks
USD/JPY holds near 155.50 after Tokyo CPI inflation eases more than expected

USD/JPY is trading tightly just below the 156.00 handle, hugging multi-year highs as the Yen continues to deflate. The pair is trading into 30-plus year highs, and bullish momentum is targeting all-time record bids beyond 160.00, a price level the pair hasn’t reached since 1990.
AUD/USD stands firm above 0.6500 with markets bracing for Aussie PPI, US inflation

The Aussie Dollar begins Friday’s Asian session on the right foot against the Greenback after posting gains of 0.33% on Thursday. The AUD/USD advance was sponsored by a United States report showing the economy is growing below estimates while inflation picked up.
Gold soars as US economic woes and inflation fears grip investors

Gold prices advanced modestly during Thursday’s North American session, gaining more than 0.5% following the release of crucial economic data from the United States. GDP figures for the first quarter of 2024 missed estimates, increasing speculation that the US Fed could lower borrowing costs.
Stripe looks to bring back crypto payments as stablecoin market cap hits all-time high

Stripe announced on Thursday that it would add support for USDC stablecoin, as the stablecoin market exploded in March, according to reports by Cryptocompare.
Bank of Japan expected to keep interest rates on hold after landmark hike

The Bank of Japan is set to leave its short-term rate target unchanged in the range between 0% and 0.1% on Friday, following the conclusion of its two-day monetary policy review meeting for April. The BoJ will announce its decision on Friday at around 3:00 GMT.