![]() Eddie Tofpik
Eddie Tofpik
ADM Investors Services International Limited
GBPUSD - Trend?
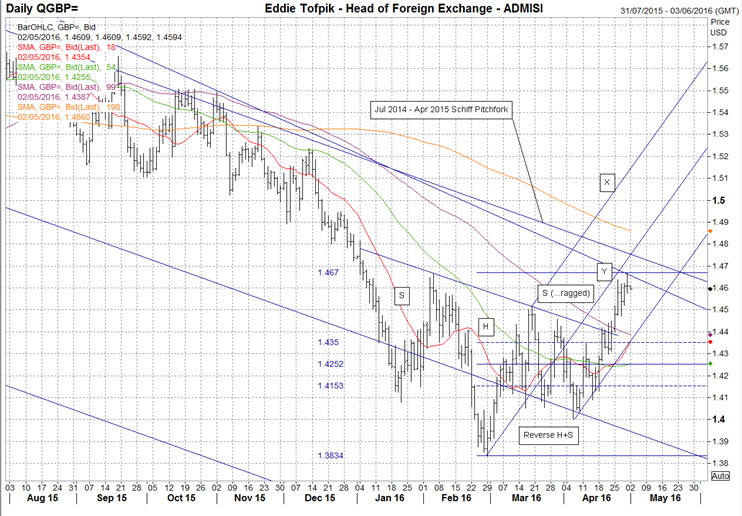
Last month I mentioned how I would ‘…readdress the whole issue once we get to 1.4052 again.’ – the old Mar lows. Well we got there and we broke down though it and made new lows. However…and it is a big ‘However…’, we only managed one close below the previous lows at 1.4052 AND other nearby closes were ABOVE the Mar closes at that time. All this plus a Bullish Matching Pattern was enough to turn things back around…along with the bullet point above into neutral. Since then we have seen the market turn back up further by testing and breaching the Mar high and now testing the Feb high. During the move up we’ve formed a Reverse H+S Pattern but with a ‘ragged’ 2nd Shoulder. I’ve marked with an ‘X’ a potential target for such a move on the chart at just short of 1.5100. Yet there are some significant resistances between 1.5100 and where we are now. Notably the Feb 2016 high at 1.4668, the Aug 2015-to-date Downtrend (currently 1.4658), the Upper Tine of the Jul 2014 – Apr 2015 Andrews Pitchfork (currently 1.4749) and of course the Long MA (currently 1.4865). Additionally, I have drawn a new bullish Andrews Pitchfork based on the action of very late Feb through to Apr which seemingly may show the current angle of attack…but the Middle Tine of this analysis in itself is also proving some resistance currently at 1.4752…though it is rising. There are other resistance points as well but these are the main ones I am concerned with. Support is currently at 1.4514, 1.4477, 1.4458, 1.4418, 1.4392(dynamic), 1.4350(combined & dynamic), 1.4298 & the current 50% Fib (dynamic) at 1.4252. I would also add the point ‘Y’ on the Daily Chart above. That is the target should all the action since late Feb just be a sloppy Bull Flag...in which case we are just about there. Overall, I am not surprised that we had a new high at the end of the month…a sure bullish sign…but also neither am I surprised that we had an indecisive Doji Cross there as well.
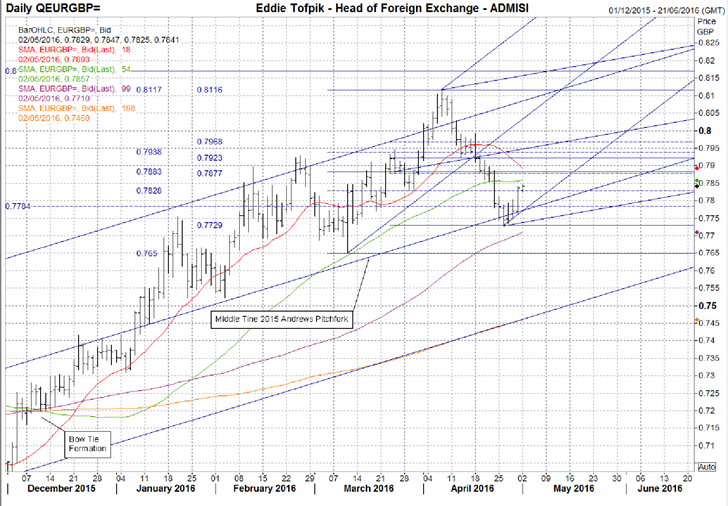
Last month I said ‘To be honest, to halt the move up temporarily you’d need consecutive closes under 0.7835…and that is without making a new high (that would compromise the support by making it higher). To make it neutral you’d need to have consecutive closes under the Medium MA (currently 0.7541) and to make it bearish you’d need consecutive closes below the Long MA (currently 0.7371). So look to the upside and the AP & SP look interesting. ‘. Well…we have halted the move higher by consecutively closing under 0.7835…but that is all we have done! In fact, the 0.7835 level is now 0.7883 as the market did indeed make new highs and compromised 0.7835. Prices went below 0.7800 and tested the support of the Middle Tine of the bullish 2015 Andrews Pitchfork (currently 0.7772) but failed to maintain the drop by a) not even testing the Medium MA (currently 0.7704) nor the Mar low at 0.7650 or b) failing to close consecutively below the Middle Tine. Prices have therefore risen since the middle of last week and it has given me an opportunity to draw some new bullish Andrews & Schiff Pitchforks on the Mar – Apr action. The key move for the recent rebound upwards would seem the previously mentioned 50% Fib at 0.7883…and I agree it is important but in the ascending action I would say the new Apr 50% Fib at 0.7923 is key. Consecutive closes over this and we are back where we were last month at this time. Resistance is currently at 0.7877 – 0.7883, 0.7923, 0.7938 – 0.7947(dynamic) & 0.7968. Support is at 0.7828, 0.7784, 0.7771(key& dynamic), 0.07737 – 0.7729, 0.7704(dynamic) & 0.7650. Given the peaking action during the month & despite the bullish turnaround of the last few days (…it is after all only a few days…) I feel obliged to tone down to a milder bullish sentiment on the bullet point above…with a question mark.
EURGBP - Trend Up?
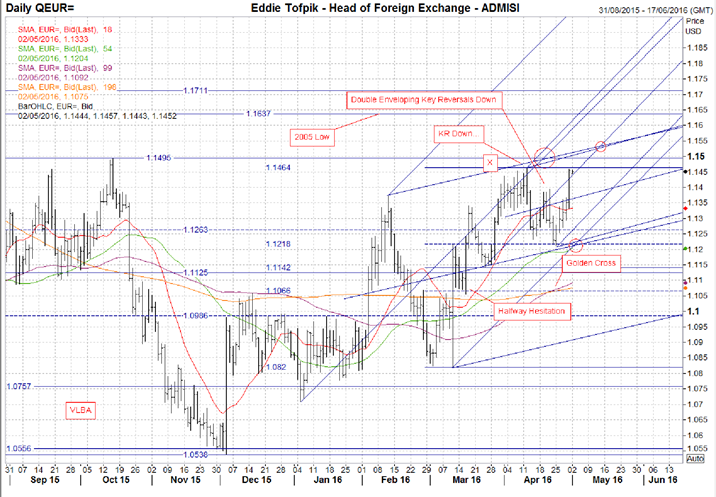
Last month I pointed out two things of significance. The first was the approach to the highly important 1.1495 high from Oct 2015 which was approximately coincident with the target marked by an ‘X’ on the Daily Chart above of the Mar – Apr Bullish Halfway Hesitation. The second was the 2016 Bullish Andrews Pitchfork and specifically the Centre Tine (currently 1.1590) which at the time seemed to act as a possible angle of attack of the market higher…or at least a cap on a sort of closing basis to the then move higher. During Apr I noted at a Platts Kingsman Sugar Conference in Geneva (where I did a presentation) how there was a crossover of the Centre Tine of the AP, the significant high plus the Upper Tine of a Schiff Pitchfork I had previously drawn. All these would happen between the 18th – 20th of Apr (marked with a large circle above) and with a bias for the 18th. I suggested that during this period there could be higher volatility or a significant change/start of direction…or both. As it turned out the 20th saw a Key Reversal Down, but that was not all. The 21st saw another KR Down…a very, very rare Double Enveloping KRs Down…I did not recall ever seeing any such before. The question was what did it mean…initially I though it meant lower (obviously) but I reserved some judgement as I had never to my recollection seen anything quite like this in FX. Needless to say, the next day we went down but halted just under the previous Apr low and just ahead of the Middle Tine of the SP…and the 61.8% Fib of the Mar – Apr move at 1.1218. Prices then formed a Bullish Piercing Line Pattern and motored back up to again to test the 2016 high. In the meantime we’d also formed a Golden Cross of the Medium MA up over the Long MA. Since then I’ve had the opportunity because of the action to draw a new AP & SP over the Mar – Apr action and would bring your attention to the two smaller circles on the 3rd – 5th and 12th – 13th where possible significant market changes may occur. Support is currently at 1.1439(dynamic), 1.1394 – 1.1386, 1.1363, 1.1263 & 1.1222 – 1.1213. Resistance is at 1.1464, 1.1495, 1.1503 – 1.1513, 1.1637 & 1.1711. Given all that has happened, it would seem appropriate to tone down the with a question mark the bullishness on the bullet point above.
EURUSD - Trend Up?
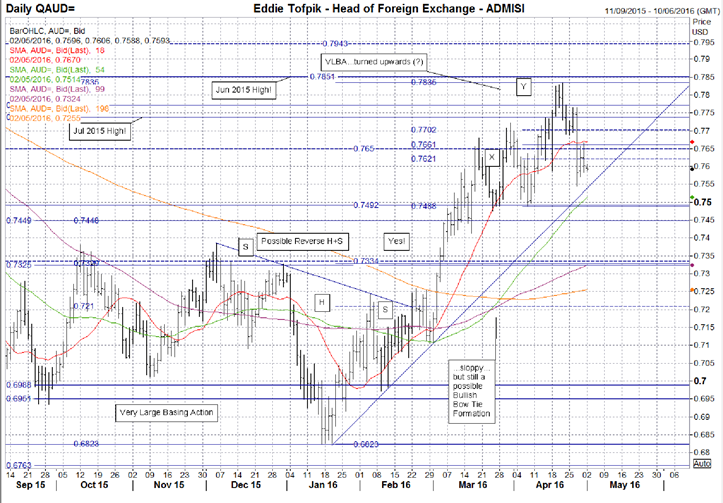
Last month I spoke about a number of things relating to this pair. 1) ‘The higher target ‘Y’ is a fast and dirty potential target for the VLBA (Very Long Basing Action) action previously mentioned. I stress, I have my doubts on the VLBA but feel obliged to point it out…however much it is an approximation.’ . Despite my concerns, I am pleased to say that the market reached the target for the VLBA at about 0.7825. 2) ‘…a possible Bullish Bow Tie Pattern of MAs. Now the ‘rules’ are that within 15 – 20 business days of the crossover the market ought to move in the direction of the expanding Bow Tie. Add to this the difficulty of actually finding a day for the mutual crossover of these MAs and you can see there are issues. So – taking the approximate midpoint…roughly the 28th of Mar…then between the 18th – 25th of Apr would see the move higher.’. An interesting one this is – on the 18th we had a huge Key Reversal Up, the second within three days and so the expectation was for higher still. The market duly delivered (making point ‘Y’ in the process) but then KRd Down with another huge KR Down only a few days later, last Wednesday…but since then nothing? All of the potential from last month has been fulfilled and now it seems the market doesn’t quite know where to go? We’ve had within the last month five of the twenty sessions as KRs, three down/two up and we’re only 66 tics lower. The volatility is disguising some uncertainty in the market that lagging indicators such as MAs would not be able to pick up. Hence, I’m putting a question mark on the bullish bullet point above…the least that ought to be done. Support 0.7588, 0.7545, 0.7538(dynamic), key at 0.7488 – 0.7492 and then 0.7448, 0.7413 & then a key band 0.7334 – 0.7325. Resistance is at 0.7621, 0.7650, 0.7661(key & dynamic), 0.7690 – 0.7702, 0.7738, 0.7771, 0.7835 & 0.7851.
AUDUSD - Trend up?
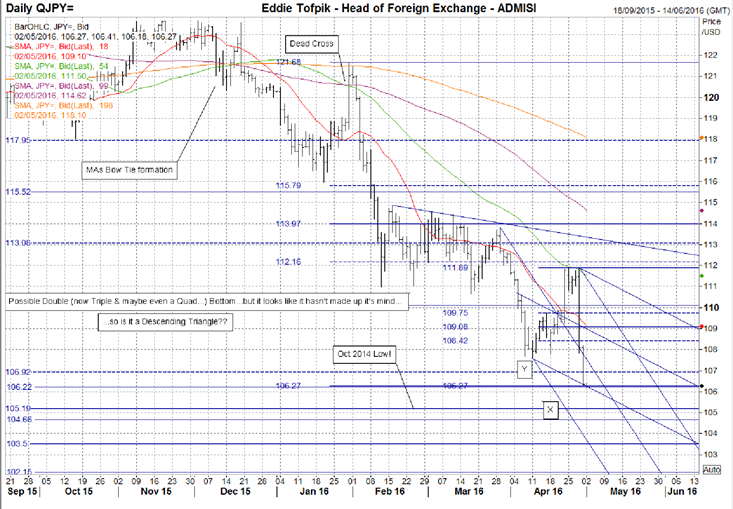
Last time I propositioned two scenarios. They were both bearish and were either a Descending Triangle Pattern with a potential target (‘Y’) of about 107.25 or a Halfway Hesitation with a further potential target (‘X’) of 105.25. All this would be dependent on the then low of 110.66 being taken out…in the case of the DT later and in the case of the HH…sooner. Well we went sooner than I’d have been pleased with on the DT so I’m minded to think it is more of a HH than a DT. Nevertheless, we’ve reached ‘Y’ & I’m glad of that though it did have some interesting action just ahead of fulfilment. The fall was just short of point Y and then bounced up…as if the market knew it was there but was reluctantly being bearish about it all. The subsequent recovery led to a bearish Double Top & though it was also a scare for the bears. I’m sure they were grateful prices did not even try the neutral point of the key 50% Fib currently at 113.97 before crashing with a Key Reversal Down. Now I’m sure you know what my thoughts are about KRs on JPY …very untrustworthy. Nevertheless, we’ve had a great KR Down last Thursday, all leading to a KR Down on the Weekly Chart as well. All the recent action has allowed me to draw bearish fresh Andrews & Schiff Pitchforks and I bring your attention to the Lower Tine of the SP (currently 106.27) which is coincident with the close for the month made last Friday as well as a previous low. Going forward, with all MAs pointing down I think it appropriate to remove the question mark on the bullet point above and go fully bearish. Support key at 106.22 then 105.19, 104.66, 103.71(dynamic), 103.50 & 102.15. Resistance is at106.92, 107.61, 107.81, 108.42, key at 109.08 then 109.75 & 110.09
USDJPY - Trend down
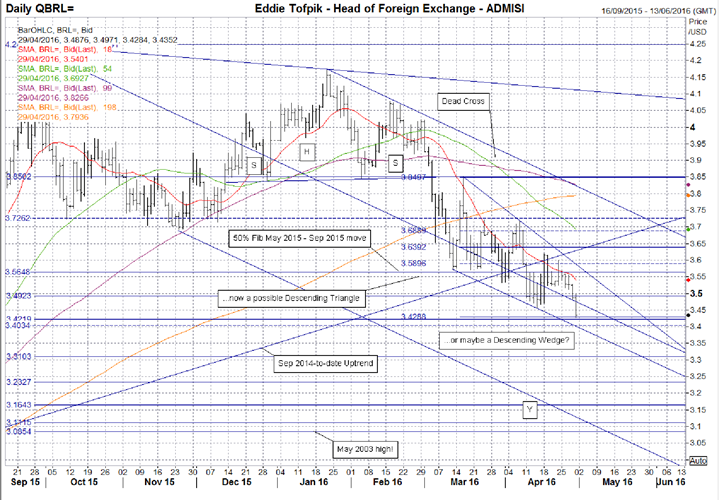
Last month I wrote extensively on the Descending Triangle Pattern that had formed over Mar…’ I now point out the possible Elephant-In-The-Room, the possible Descending Triangle formed from the whole of the Mar action. In this case the ‘Y’ on the Daily Chart above marks a potential target for such a pattern (about 3.1650).’. The DT has evolved in to a Descending Wedge. Now I am not very keen on DWs as it is difficult to suggest which direction a break could go into…they are unreliable other than to gauge the size of the move…but also this DW is in the wrong place, it should be earlier…but I’ll reserve judgement just yet – I’ll keep point ‘Y’ just in case. I also wrote about the merits of the Bearish Sep 2015 – Jan 2016 Andrews Pitchfork. This is still there and the Middle Tine seems to be showing the angle of attack of the market lower at the moment. Finally I wrote about a seeming congregation ‘…between the 22nd of Mar & the 15th of Apr with possibly important dates within on the 4th & 8th of Apr.’. Though seemingly unimportant, I would draw your attention to the 7th which was not only the high in Apr but was also the second point in the Downtrend forming the DW and I think the point at which the market chose not to go for a DT but for a DW. Pattern. I had one other area potentially marked out – the 20th of Apr – but this turned out to be nothing…though the nearby 22nd was significant. So where are we now? Well it would not be unusual to travel a little further lower down the DT with support currently at 3.3971 & resistance 3.5794. 3.4715 is currently the Centre Tine of the AP and falls by about 50 tics a day…watch this if you agree on the idea of the angle of attack. Further support is at 3.4219, 3.4034, 3.3103, 3.2327 & 3.1643. Resistance is as well as the previously mentioned numbers at 3.4567, 3.4923, 3.5222, 3.5648, 3.5896, 3.5999, 3.6180 & key plus dynamic at 3.6392. With three out of four MAs turned down I think it appropriate to push the bullet point above into neutral.
USDBRL - Trend?
BTCUSD - Trend up?
ADM Investor Services Limited – FCA No 148474 Disclaimer This information has been has been issued by ADM Investor Services International Limited (“ADMISI”) in accordance with ADMISI’s Investment Research Policy. This information is only intended to be distributed to existing Eligible Counterparties and Professional Clients of ADMISI. Further, ADMISI’s investment research is intended for use solely by Eligible Counterparties and Professional Clients, who possess a certain degree of knowledge and experience in the subject of this information. Therefore the contents may refer to terms and subjects that may be unsuitable for Retail Clients and this information should not under any circumstances be forwarded to a Retail Clients. This content is for information purposes only and should not be construed as an offer, solicitation or recommendation to buy or sell any investments or investment advice. ADMISI does not recommend or endorse any particular investment, or course of action. This information has no regard for any investment objectives or financial situation of any Eligible Counterparty or Professional Client. Any investment that is referred to may warrant further investigation or research, which will be solely at the discretion of the Eligible Counterparty or Professional Client. Information and opinions expressed herein are based on sources believed to be reliable, however ADMISI does not represent that they are accurate or complete. Further any views or information are based upon judgements made as at the date of this information. All opinions and information are subject to change without notice. ADMISI and/or connected persons may from time to time have positions in or effect transactions in any investment or related investment mentioned herein and may provide financial services to the issuers or such investments. ADMISI has put in place systems and controls mechanisms supported by appropriate procedures to identify and manage any conflicts of interest that may arise. A copy of ADMISI’s Conflict of Interest Policy is available upon request. In relation to this content, ADMISI does not believe that any relationships, circumstances, interests or potential conflicts of interest that would require disclosure under the FCA Conduct of Business rules are likely to arise. In particular no major shareholdings or financial interests exist between ADMISI and any relevant company. In the event that this situation changes then appropriate disclosures will be made. All investments involve a degree of risk and may not be suitable for certain investors. All investors should make their own investment decisions based on their circumstances, financial objectives and resources and after seeking any appropriate professional advice. This information has not been prepared under the Independent Investment research regulatory requirements and accordingly there is no prohibition on dealing ahead of the dissemination of this research material. ADM Investor Services International Limited is authorised and regulated by the Financial Conduct Authority FCA Number 148474 in the UK.
Recommended Content
Editors’ Picks

GBP/USD rises above 1.3300 after UK Retail Sales data
GBP/USD trades with a positive bias for the third straight day on Friday and hovers above the 1.3300 mark in the European morning on Friday. The data from the UK showed that Retail Sales rose at a stronger pace than expected in August, supporting Pound Sterling.

USD/JPY recovers to 142.50 area during BoJ Governor Ueda's presser
USD/JPY stages a modest recovery toward 142.50 in the European morning following the initial pullback seen after the BoJ's decision to maintain status quo. In the post-meeting press conference, Governor Ueda reiterated that they will adjust the degree of easing if needed.

Gold consolidates weekly gains, with sight on $2,600 and beyond
Gold price is looking to build on the previous day’s rebound early Friday, consolidating weekly gains amid the overnight weakness in the US Dollar alongside the US Treasury bond yields. Traders now await the speeches from US Federal Reserve monetary policymakers for fresh hints on the central bank’s path forward on interest rates.

Shiba Inu is poised for a rally as price action and on-chain metrics signal bullish momentum
Shiba Inu remains strong on Friday after breaking above a symmetrical triangle pattern on Thursday. This breakout signals bullish momentum, further bolstered by a rise in daily new transactions that suggests a potential rally in the coming days.

Bank of Japan set to keep rates on hold after July’s hike shocked markets
The Bank of Japan is expected to keep its short-term interest rate target between 0.15% and 0.25% on Friday, following the conclusion of its two-day monetary policy review. The decision is set to be announced during the early Asian session.

Moneta Markets review 2024: All you need to know
VERIFIED In this review, the FXStreet team provides an independent and thorough analysis based on direct testing and real experiences with Moneta Markets – an excellent broker for novice to intermediate forex traders who want to broaden their knowledge base.