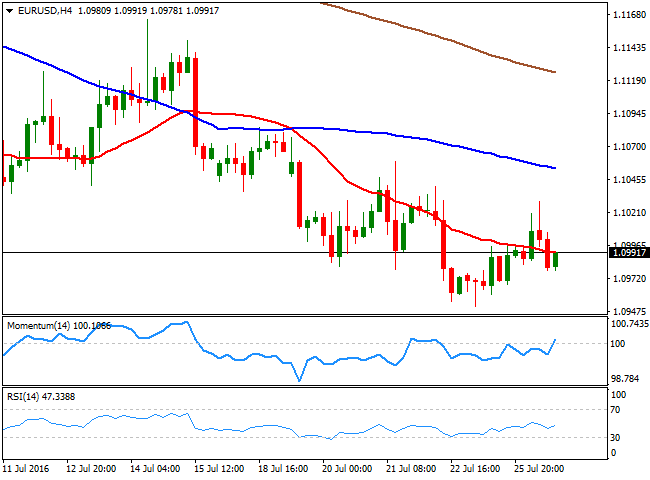
EUR/USD Current price: 1.0991
View Live Chart for the EUR/USD
The EUR/USD pair treaded water for a second consecutive day around the 1.1000 level, unable to settle above it in spite of dollar's early weakness, triggered by yen's demand. Besides yen's sharp appreciation, there was little going on across the board, as investors remained side-lined ahead of the FOMC's announcement this Wednesday. The US Central Bank is undergoing its two-day policy meeting, but is largely expected to maintain its rates unchanged, while at the same time, offering some encouraging words over the latest macroeconomic developments in the country. A batch of positive data during the last month has revived hopes of a tighter economic policy in the world's largest economy, albeit worldwide uncertainties persists, and seems unlikely the FED will dare to act this year.
US data was generally positive, with Consumer Confidence pretty much unchanged in July, as the index stands at 97.3 from 97.4 in June. New Home sales rose by 3.5% in June, to a seasonally adjusted annual rate of 592,000, the strongest pace since February 2008. Also, house prices continued to rise across the country, although moderating its pace, up by 5.2% in May and compared to a year before. The negative note was given by the Markit flash Services PMI, with activity rising at the weakest pace in the current five-month sequence of expansion, resulting at 50.9 from previous 51.4.
Short term technical readings have nothing to offer with the price stuck within range, although the downward risk persists, considering that the pair has been steadily printing lower highs. Still lacking directional strength, technical indicators in the 4 hours chart hold within neutral territory, while the price is stuck around a modestly bearish 20 SMA, in line with the negative tone of the common currency. The EUR/USD pair set a lower low for the week at 1.0951, with a break below it opening doors for a retest of 1.0910, the post-Brexit low, en route to the 1.0800/40 strong static support zone.
Support levels: 1.0955 1.0910 1.0840
Resistance levels: 1.1000 1.1050 1.1090
EUR/JPY Current price: 115.11
View Live Chart for the EUR/JPY
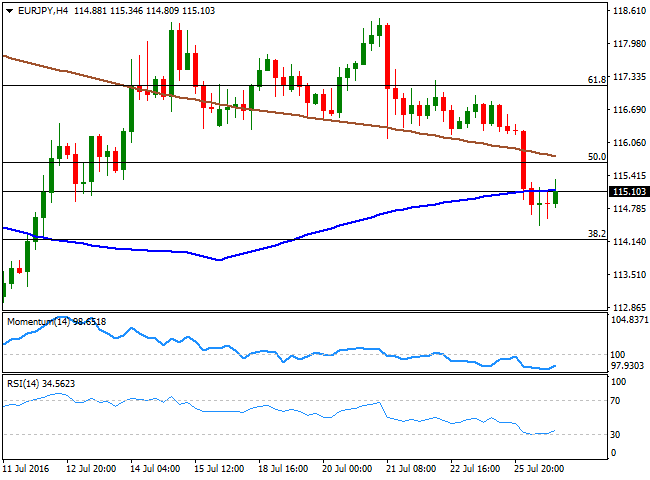
The EUR/JPY pair fell down to 114.45 as hopes for massive stimulus faded on news the upcoming fiscal stimulus, to be announced early August, falls short of expectations. Market talks over a 10trillion yen plan got smashed after a leak showed that the supplementary budget for fiscal 2016 will likely provide around 2 trillion yen, with much of it intended for public work. The pair bounced from the mentioned low, but was barely able to settle above the 115.00 level by the US close, holding on to its negative tone in the short term, as in the 1 hour chart, the 100 SMA has accelerated lower below the 200 SMA, well above the current level, while the technical indicators lost upward strength around their mid-lines, after correcting extreme oversold readings reached earlier in the day. In the 4 hours chart, the price has broken below its 100 SMA, now holding right below it, while the technical indicators remain within negative territory, with no certain directional strength. The pair has a strong Fibonacci support around 114.20, the 38.2% retracement of the post-Brexit´s slide, and the level to break to confirm additional slides this Wednesday.
Support levels: 114.60 114.20 113.70
Resistance levels: 115.40 115.85 106.10
GBP/USD Current price: 1.3147
View Live Chart for the GBP/USD
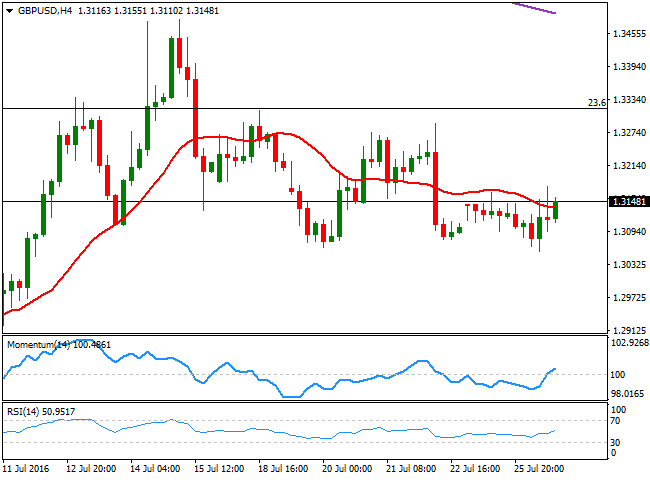
The Pound Sterling weakened at the beginning of the day, falling down to 1.3056 against the greenback, the lowest in two weeks, after MPC member, Martin Weale, shifted it stance, and now favors adding more stimulus to the local economy. The pair bounced from the mentioned low up to 1.3175, ending the day with moderated gains around 1.3150, but maintaining the neutral bias seen on previous updates. Data coming from the UK showed that mortgages approvals in June, fell to 40.1K against previous 41.8K, while business borrowing in the same month dropped for the first time in 2016, down by £526m last month to £262.4m. From a technical perspective, the pair has nothing new to offer, confined to a tight range around the 1.3100 figure, and with the 4 hours chart showing that the price is still below a horizontal 20 SMA, while the technical indicators remain stuck around their mid-lines. The lack of directional strength will likely persists until the upcoming BOE's meeting in August, with 1.3000 and 1.3320 being the extremes of the range and the levels to break to see some follow through afterwards.
Support levels: 1.3115 1.3080 1.3045
Resistance levels: 1.3175 1.3230 1.3260
USD/JPY Current price: 104.68
View Live Chart for the USD/JPY
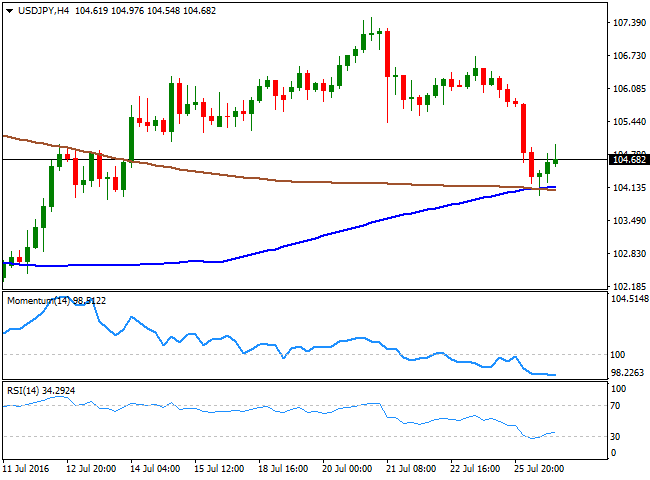
Yen shorts got squeezed this Tuesday, as investors fear the Bank of Japan will end up providing less stimulus than the one initially estimated. Comments from Finance Minister Taro Aso, saying that the government is yet to decide on the size of the economic stimulus package and that he trusts the BOJ will act as needed, underpinned the JPY, also supported by rumors suggesting the upcoming fiscal stimulus will be less than half the expected 10trillion yen. The Bank of Japan will have its economic policy meeting this week, with most analyst expecting the Central Bank to cut rates further into negative territory from the current -0.10%. The USD/JPY trimmed partially its daily losses, recovering up to the 104.60 region after trading as low as 103.99 during the past Asian session. From a technical point of view, the 1 hour chart shows that the price has met selling interest on an approach to the 105.00 level, while developing well below its moving averages, suggesting the upward potential is now limited. In the same chart, the RSI indicator has turned back south after correcting extreme oversold readings, now around 41, also supporting a bearish extension for the upcoming hours. In the 4 hours chart, the technical indicators maintain modest bearish slopes near oversold territory, while the 100 and 200 SMAs converge in the 104.00/10 region, indicating that renewed selling interest through the level, will end up at fresh lows closer to the 103.00 level.
Support levels: 104.00 103.60 103.20
Resistance levels: 104.80 105.30 105.70
AUD/USD Current price: 0.7506
View Live Chart for the AUD/USD
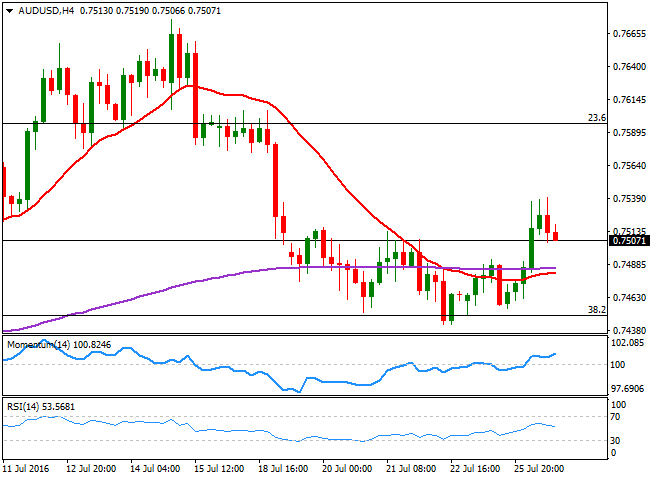
The AUD/USD pair recovered ground this Tuesday, as buying interest defended the 0.7450 region. The pair traded as high as 0.7539 during the US afternoon, with no macroeconomic catalyst beyond the recovery, beyond the rates' differential between Australia and other major economies. The pair closed the day a handful of pips above the 0.7500 level, its highest in a week, and will face a major challenge during the upcoming Asian session, with the release of Australian Q2 trimmed CPI, expected at 1.5% from previous 1.7%. If inflation comes in below expected, the RBA will be one step closer to cut rates again, meaning that the Aussie may give back its recent gains and even extend its decline beyond the critical Fibonacci support at the mentioned 0.7450 level. Technically, the 1 hour chart favors a continued decline, given that the price is back below its moving averages, while the Momentum indicator heads lower below its 100 level almost vertically. In the 4 hours chart, however, the RSI indicator heads modestly lower around 53, but the Momentum indicator keeps heading higher above its mid-line, while the price stands above its moving averages, providing an immediate support around 0.7480.
Support levels: 0.7490 0.7450 0.7410
Resistance levels: 0.7540 0.7590 0.7635
Information on these pages contains forward-looking statements that involve risks and uncertainties. Markets and instruments profiled on this page are for informational purposes only and should not in any way come across as a recommendation to buy or sell in these assets. You should do your own thorough research before making any investment decisions. FXStreet does not in any way guarantee that this information is free from mistakes, errors, or material misstatements. It also does not guarantee that this information is of a timely nature. Investing in Open Markets involves a great deal of risk, including the loss of all or a portion of your investment, as well as emotional distress. All risks, losses and costs associated with investing, including total loss of principal, are your responsibility. The views and opinions expressed in this article are those of the authors and do not necessarily reflect the official policy or position of FXStreet nor its advertisers. The author will not be held responsible for information that is found at the end of links posted on this page.
If not otherwise explicitly mentioned in the body of the article, at the time of writing, the author has no position in any stock mentioned in this article and no business relationship with any company mentioned. The author has not received compensation for writing this article, other than from FXStreet.
FXStreet and the author do not provide personalized recommendations. The author makes no representations as to the accuracy, completeness, or suitability of this information. FXStreet and the author will not be liable for any errors, omissions or any losses, injuries or damages arising from this information and its display or use. Errors and omissions excepted.
The author and FXStreet are not registered investment advisors and nothing in this article is intended to be investment advice.
Recommended Content
Editors’ Picks
EUR/USD edges lower toward 1.0700 post-US PCE

EUR/USD stays under modest bearish pressure but manages to hold above 1.0700 in the American session on Friday. The US Dollar (USD) gathers strength against its rivals after the stronger-than-forecast PCE inflation data, not allowing the pair to gain traction.
GBP/USD retreats to 1.2500 on renewed USD strength

GBP/USD lost its traction and turned negative on the day near 1.2500. Following the stronger-than-expected PCE inflation readings from the US, the USD stays resilient and makes it difficult for the pair to gather recovery momentum.
Gold struggles to hold above $2,350 following US inflation

Gold turned south and declined toward $2,340, erasing a large portion of its daily gains, as the USD benefited from PCE inflation data. The benchmark 10-year US yield, however, stays in negative territory and helps XAU/USD limit its losses.
Bitcoin Weekly Forecast: BTC’s next breakout could propel it to $80,000 Premium

Bitcoin’s recent price consolidation could be nearing its end as technical indicators and on-chain metrics suggest a potential upward breakout. However, this move would not be straightforward and could punish impatient investors.
Week ahead – Hawkish risk as Fed and NFP on tap, Eurozone data eyed too

Fed meets on Wednesday as US inflation stays elevated. Will Friday’s jobs report bring relief or more angst for the markets? Eurozone flash GDP and CPI numbers in focus for the Euro.