Market Overview
Equity markets rebounded fairly positively yesterday to leave the glass half full as we approach a crucial few days of economic data. Wall Street having traded over a percent lower recovered much of the losses into the close to end the day around 0.25% lower. The pro-democracy protests have played a role in the weakness over the past few days, but unless the situation deteriorates dramatically, focus will turn towards global growth, the ECB and of course Non-farm Payrolls in the coming days.
Despite this though, Asia markets were mixed to lower, with Hong Kong off another percent and the Japanese Nikkei 225 also over a percent lower after disappointing Japanese trade data and the final reading of the HSBC China manufacturing PMI just dipped to 50.2 which was below the first reading and expectations of 50.5. European markets are mixed in early trading.
After several days of US dollar strength, the greenback has started the day on a negative note, losing ground across all the majors. The Aussie and Kiwi dollars are finally looking to fight back, both around half a percent higher on the day. The major focus for traders today will come from the Eurozone. After re-assuring German inflation data yesterday, the flash Eurozone CPI at 10:00BST is key. Expectation is for a dip to 0.3% (from 0.4% last month) but also look at the core CPI reading which is expected to come in at 0.9%. Anything about these forecasts would be supportive for the euro. There is also Eurozone unemployment at the same time, with 11.5% the expectation. Into the US session, there is the Case/Shiller Home Price Index at 14:00BST which has impacted the markets in recent months, whilst at 15:00BST the US Conference Board’s Consumer Confidence is released with a slight uptick expected to 92.5.
Chart of the Day – S&P 500
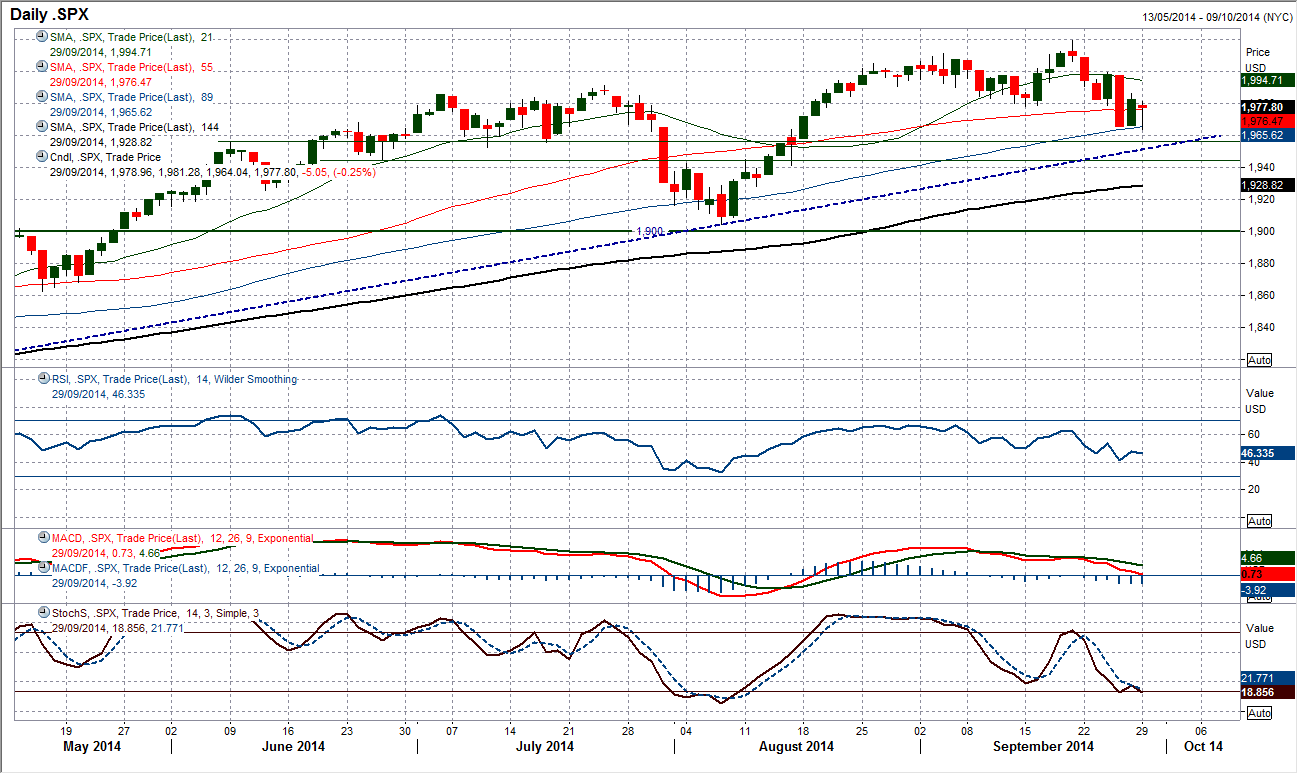
Could yesterday’s session be the one to kick start the gains on Wall Street after a week of spluttering? Having been trading around a percent lower through the morning a late session rally resulted in a close not far from the high of the day. Although not quite, the session could almost be described as leaving a bull hammer (the red candlestick body should strictly be green). The rebound yesterday came from just above the support band 1945/1955, in addition to the primary uptrend support which is currently at 1951. Furthermore, the momentum indicators which remain in long term bullish configuration are all now back to levels where the bulls will consider the momentum fully unwound again. Over the next few days, the key fundamental data will be in focus, however the technical position on the S&P 500 is ready for the next bull leg.
EUR/USD
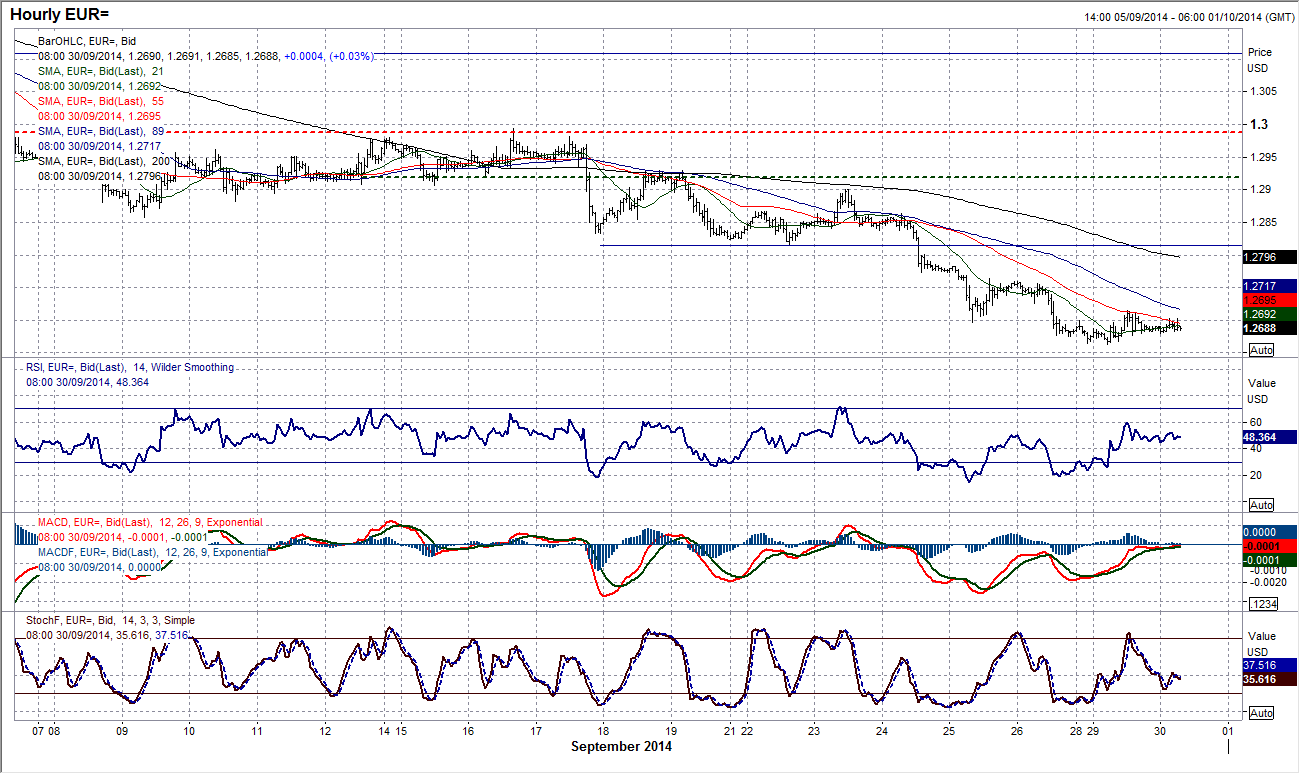
With a lack of driving economic data over the past few days, the euro has been running off technicals and hence why it has been in steady decline. With several key supports breached the outlook remains very weak, however the final major reaction low at $1.2660 is so far holding. There are very minor signs of support, with a doji candlestick yesterday (open and close at the same level denoting uncertainty with the prevailing trend). This uncertainty is understandable we move into a crucial period dominated by key fundamental data, starting with today’s Eurozone inflation and unemployment. There is no doubt that the chart is incredibly weak, however this does not mean that minor rallies will not be seen every now and again. Rallies tend to be 50 to 100 pips recently, with around 140 pips the biggest low to high move seen over the past few months. Could we be set for another rebound? Intraday resistance is at $1.2740 and $1.2815.
GBP/USD
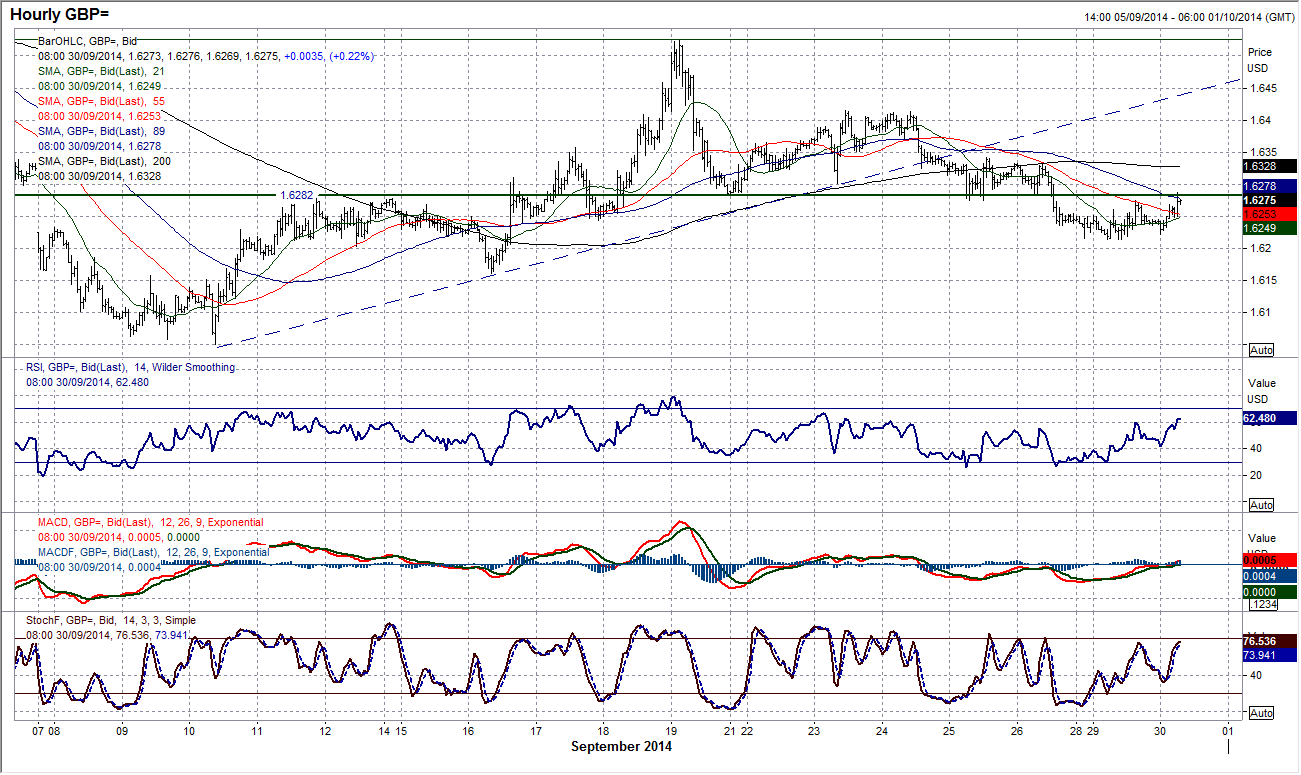
A very slight degree of support has come in overnight around $1.6210 as Cable has looked to begin the European session in positive vein. However with the downtrend being re-asserted over the past few days there is much that needs to be done for the bulls to be in control. The previous support around $1.6280 is now the first basis of resistance and needs to be overcome, however the main intraday resistance comes with key lower high at $1.6340. With these two levels intact we must be viewing any recoveries as a chance to sell as the daily chart shows the momentum indicators with renewed downside potential and the likelihood of a retreat to test the low at $1.6160 in due course.
USD/JPY
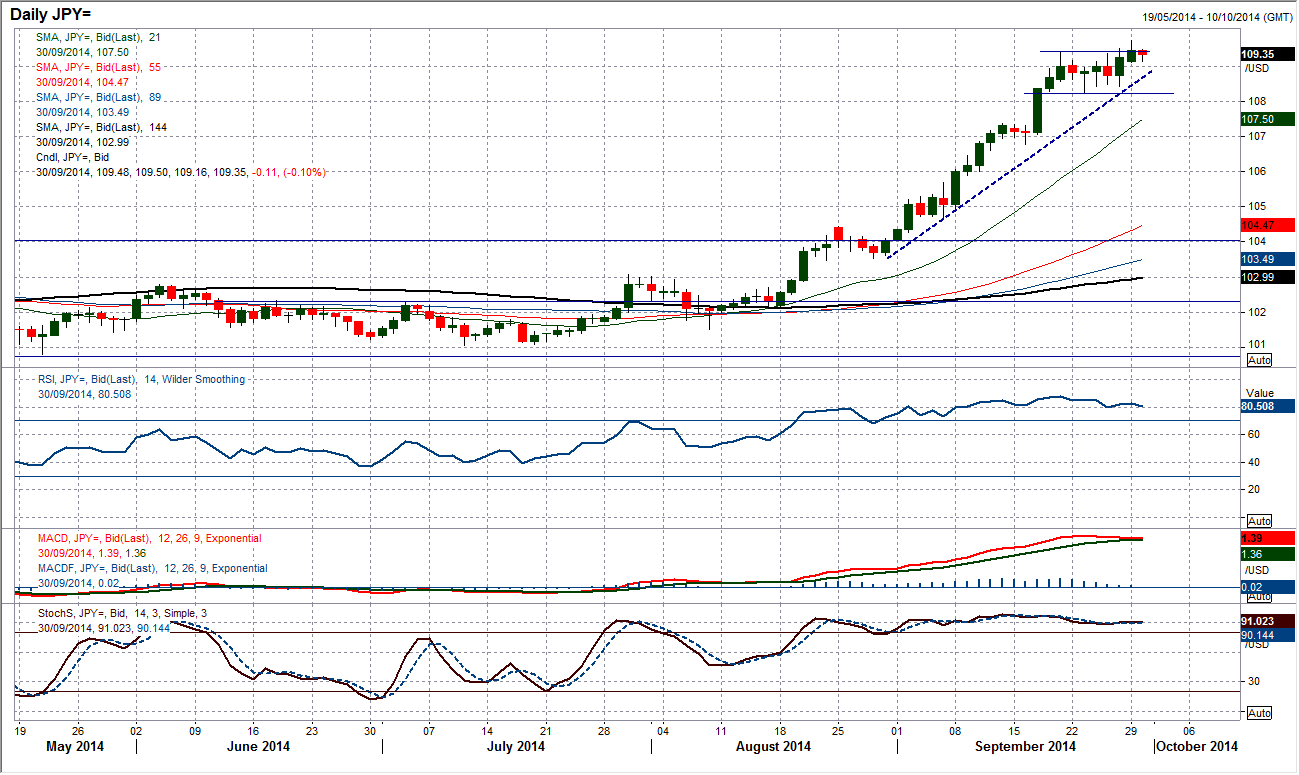
The move above 109.45 yesterday gives us an implied target for the consolidation breakout of 110.65 which also coincides with the next key resistance from August 2008. The recent 4 week uptrend remains intact, with the support today coming in at 108.70. Momentum indicators remain positive although there is just a hint of the MACD lines threatening to roll over (this would probably be the first take profit signal, so watch this space). The intraday chart remains positive, although there is a very slight sense that the breakout needs to continue higher to sustain the bullish impetus. Yesterday’s high at 109.74 is the immediate resistance and if this is taken out then the upside will be once more open to 110.65. Initial support comes in at 109.00, and then 108.50 with the key near term support at 108.24.
Gold
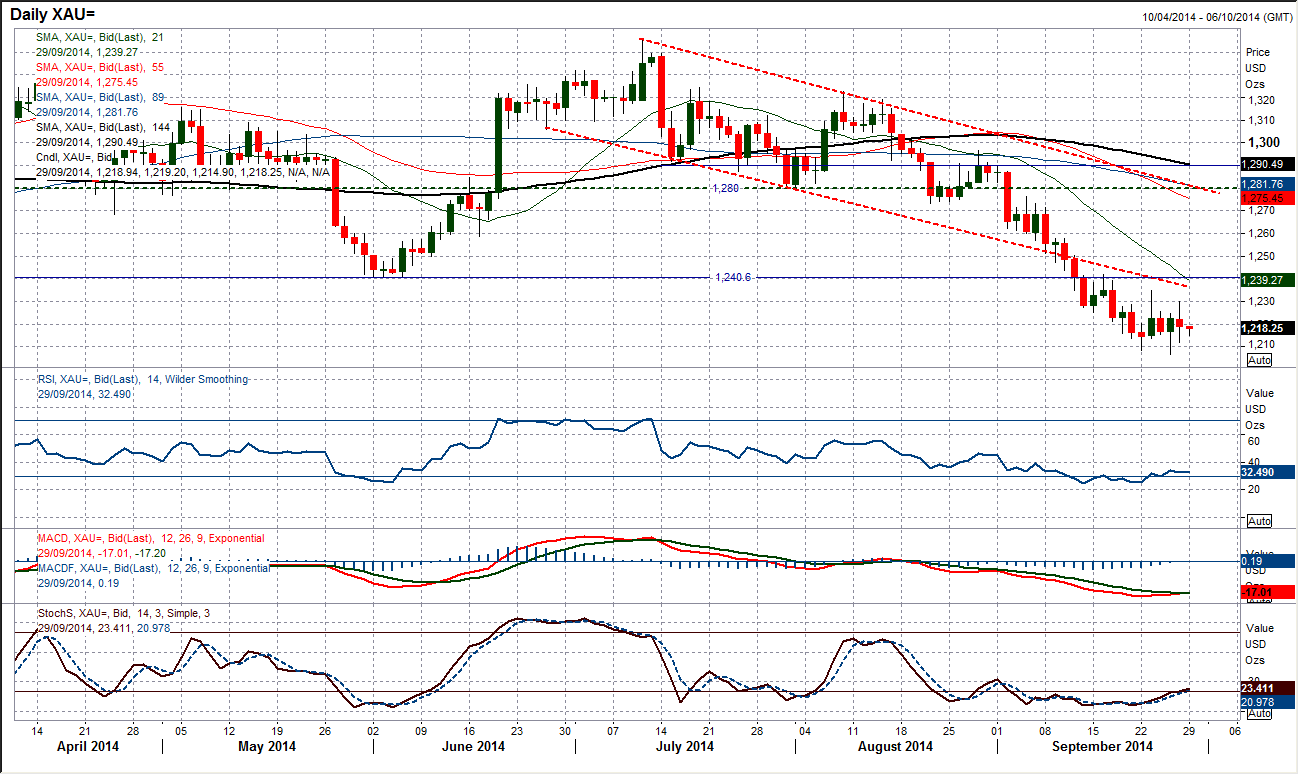
The gold price is making little progress either way as consolidation continues. However the downside pressure remains in force, with gold trading below the increasingly important resistance of the old downtrend channel which has been the barrier to gains on four occasions over the past two weeks. The momentum indicators are still not doing anything for the bulls, and with the bearish outlook that the chart retains any rebound would still be seen as a chance to sell. With the trend your friend there is still a sense that the next break will be to the downside as there have been no lower highs breached for weeks now. The latest resistance is at $1230 and $1234.80. I still expect a move back to $1200 and ultimately $1184.50.
WTI Oil
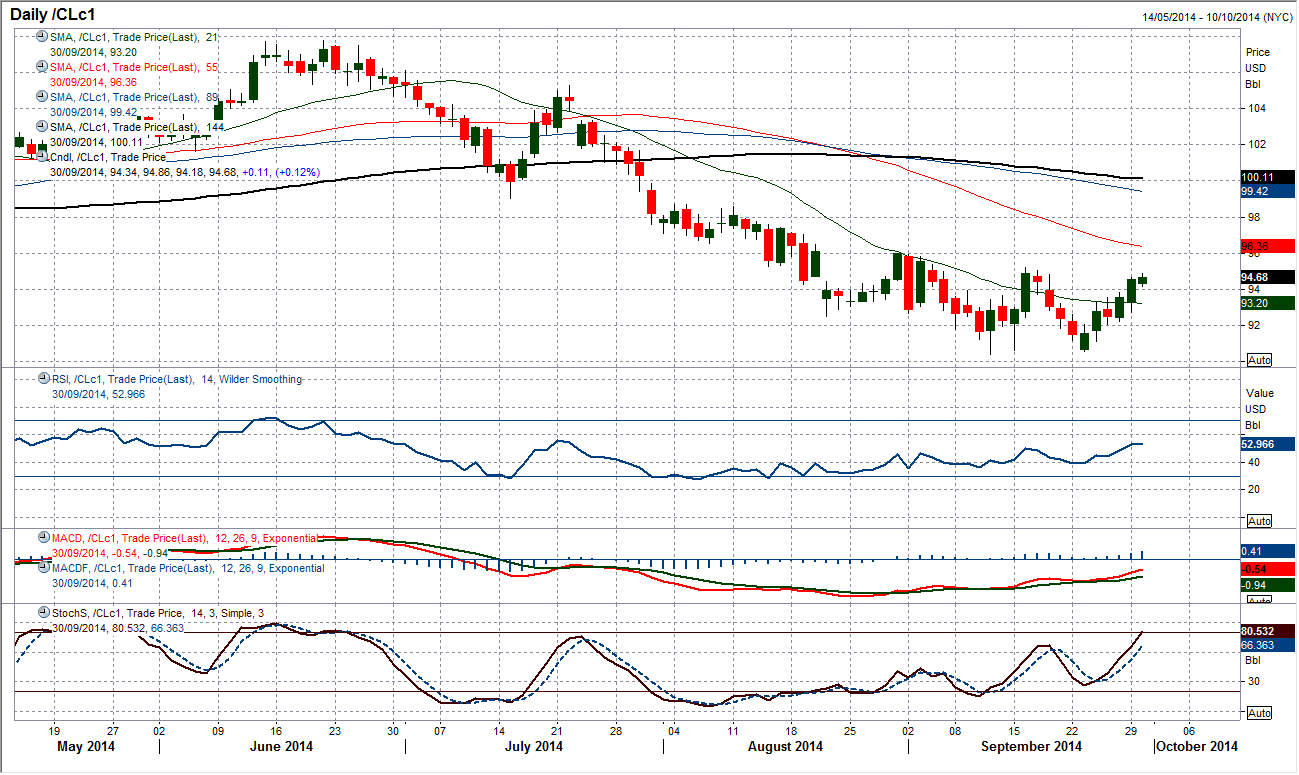
The pace of decline may have slowed in recent weeks, however the notion of a serious recovery remains still in its formative stages. A series of key lower highs over the past few weeks on the daily chart is capping the gains, with the latest resistance now at $95.19 following the key high at $96.00 at the start of September. Despite this though, support has formed at $90.58 and the intraday hourly chart shows that the bulls are mounting a challenge, which has left reaction lows at $92.05 and $91.12 over the past week. The daily momentum indicators are just drifting to unwind the move, with the RSI already unwinding to around 50 which would suggest that downside potential has been renewed. This therefore becomes a key moment for WTI as a failure to break back above $95.19 could easily result in the next downward leg. To at least retest the lows at $90.58/$90.43.
Note: All information on this page is subject to change. The use of this website constitutes acceptance of our user agreement. Please read our privacy policy and legal disclaimer. Opinions expressed at FXstreet.com are those of the individual authors and do not necessarily represent the opinion of FXstreet.com or its management. Risk Disclosure: Trading foreign exchange on margin carries a high level of risk, and may not be suitable for all investors. The high degree of leverage can work against you as well as for you. Before deciding to invest in foreign exchange you should carefully consider your investment objectives, level of experience, and risk appetite. The possibility exists that you could sustain a loss of some or all of your initial investment and therefore you should not invest money that you cannot afford to lose. You should be aware of all the risks associated with foreign exchange trading, and seek advice from an independent financial advisor if you have any doubts.
Recommended Content
Editors’ Picks

USD/JPY drops toward 142.00 ahead of BoJ policy decision
USD/JPY has turned south, approaching 142.00 in the Asian session on Friday. Markets turn risk-averse and flock to the safety in the Japanese Yen while the Fed-BoJ policy divergence and hot Japan's CPI data also support the Yen ahead of the BoJ policy verdict.

AUD/USD bears attack 0.6800 amid PBOC's status-quo, cautious mood
AUD/USD attacks 0.6800 in Friday's Asian trading, extending its gradual retreat after the PBOC unexpectedly left mortgage lending rates unchanged in September. A cautious market mood also adds to the weight on the Aussie. Fedspeak eyed.

Gold price treads water below record peak, awaits Fedspeak
Gold price hovers below the all-time peak touched earlier this week amid a bearish US Dollar and rising bets for more upcoming rate cuts by the Fed. Concerns over an economic downturn in China keep the safe-haven Gold price afloat. Fedspeak remains on tap.

Bank of Japan set to keep rates on hold after July’s hike shocked markets
The Bank of Japan is expected to keep its short-term interest rate target between 0.15% and 0.25% on Friday, following the conclusion of its two-day monetary policy review. The decision is set to be announced during the early Asian session.

XRP eyes gains as Ripple gears up for stablecoin launch, Grayscale XRP Trust notes rising NAV
Ripple (XRP) gained 2.3% since the start of the week. The altcoin’s gains are likely powered by key market movers that include Ripple USD (RUSD) stablecoin, Grayscale XRP Trust performance and the demand for the altcoin among institutional investors.

Moneta Markets review 2024: All you need to know
VERIFIED In this review, the FXStreet team provides an independent and thorough analysis based on direct testing and real experiences with Moneta Markets – an excellent broker for novice to intermediate forex traders who want to broaden their knowledge base.
