EUR/USD Current Price: 1.1525
View Live Chart for the EUR/USD
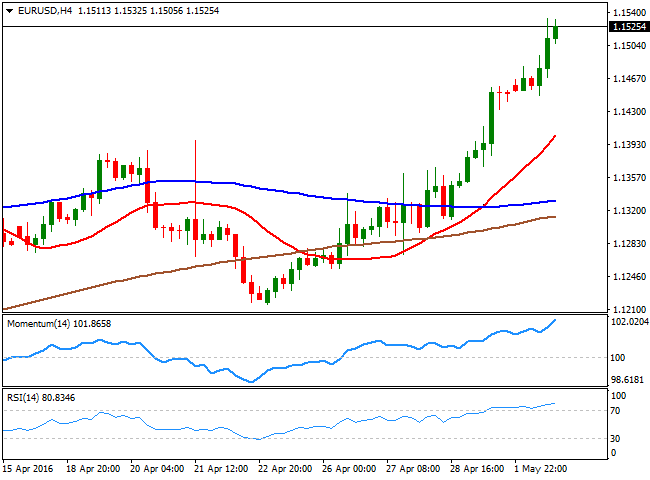
A new month starts with an old trend, as the greenback kept falling against all of its major rivals this Monday. The EUR/USD pair traded as high as 1.1534, and closed the day firmly above the 1.1500, propelled by dollar's weakness. Data coming from Europe showed that the manufacturing sector in the region grew modestly in April, as the final revisions of the Markit manufacturing PMIs came in mixed, with German reading up to 51.8, from March's 50.7, but below expectations, whilst the EU figure resulted at 51.7 and French one plummeted to 48.0.
Things in the US were not better, as the ISM manufacturing declined to 50.8 in April from 51.8 in March, whilst the Markit manufacturing PMI also printed 50.8. Also released this Monday, US construction spending advanced in March to its highest level in more than eight years, up 0.3% from the previous month, giving hopes the first quarter slowdown receded, at least in the housing sector.
The pair stands at its highest since the Chinese black Monday from August 2015 when the pair reached 1.1713 and well above the 1.1460 region, now a major support level. As long as retracements towards the level attract buying interest, the pair has scope to test such high. Intraday charts show that the bullish tone persists, despite indicators stand in extreme overbought territory. Some consolidation could be expected ahead of the Nikkei opening, yet additional advances beyond 1.1545, now the immediate resistance, should support an upward continuation for this Tuesday.
Support levels: 1.1460 1.1420 1.1380
Resistance levels: 1.1545 1.1590 1.1630
EUR/JPY Current price: 122.63
View Live Chart for the EUR/JPY
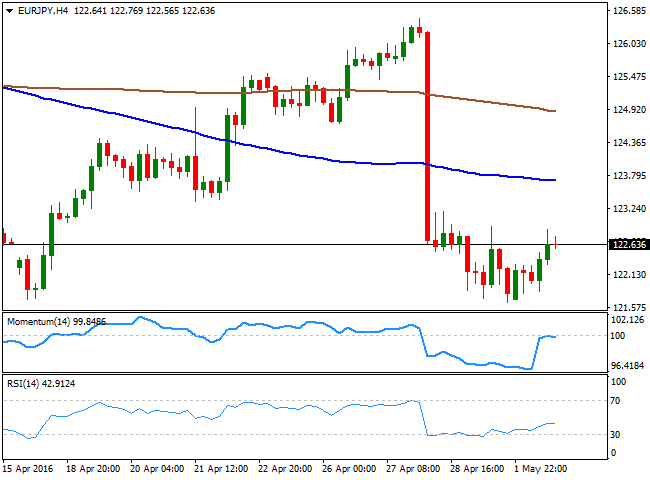
The EUR/JPY pair managed to recover some ground this Monday, as the JPY pared gains and turned lower amid Wall Street's gains. The pair however, trades below Friday's high of 122.93, and needs to advance beyond it to be able to post a more sustainable recovery. Short term, the 1 hour chart shows that the technical indicators remain flat within positive territory, but also that the 100 SMA accelerated its decline and heads south below the 200 SMA, with the shortest around 123.60, becoming a probable bullish target should the ongoing advance extended. In the 4 hours chart, the technical indicators corrected their extreme oversold conditions, but the recoveries stalled below their mid-lines and are currently turning back south, indicating the upside potential is still limited.
Support levels: 122.20 121.70 121.30
Resistance levels: 122.90 123.40 122.85
GBP/USD Current price: 1.4667
View Live Chart for the GBP/USD
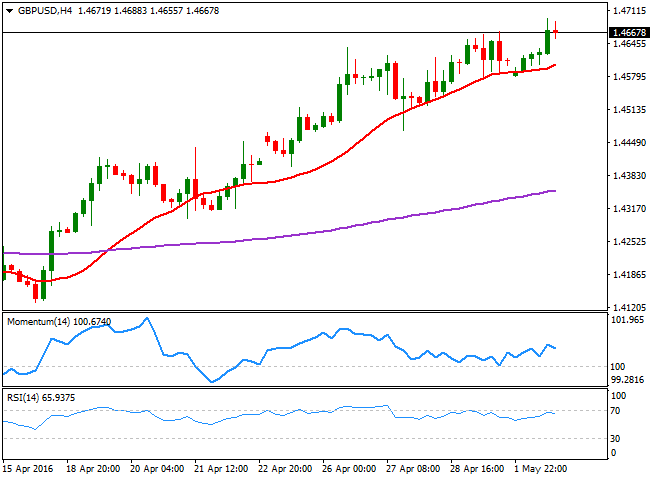
The GBP/USD pair advanced up to 1.4695, its highest in four months, and holds nearby at the end of the day, with no certain catalyst behind the mode beyond dollar's own weakness. Relief over the possibility of a Brexit has kept the Pound surging during the previous weeks, but the rally stalled amid poor UK macroeconomic data, pointing for a continued slowdown in the local economy. The kingdom will release its manufacturing figures this Tuesday, and given the releases of this Monday, the figure will likely disappoint, weighing on the GBP. From a technical point of view, and despite the rally extended, the upside is looking slightly exhausted, as in the 4 hours chart, the technical indicators lack clear directional strength, having turned modestly lower within positive territory. In the mentioned time frame, however, the 20 SMA keeps heading higher and acting as dynamic support, now around 1.4605, the level to break to confirm a downward move for the upcoming sessions.
Support levels: 1.4655 1.4605 1.4570
Resistance levels: 1.4710 1.4750 1.4790
USD/JPY Current price: 106.53
View Live Chart for the USD/JPY
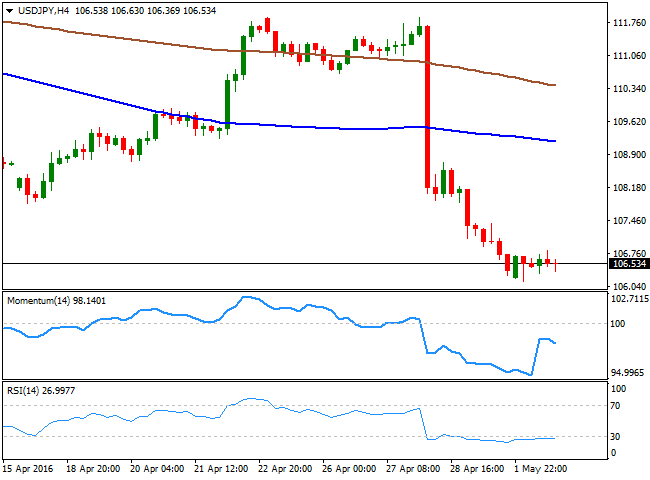
The USD/JPY plunged to a fresh 18-month low of 106.13 early Asia before posting a shallow bounce, still trading below the 107.00 figure. Data coming from Japan indicated that April manufacturing PMI declined to 48.2, against an initial estimate of 48.0 and March final reading of 49.1, below the 50 threshold and with manufacturing conditions deteriorating at the sharpest rate in over three years. The pair is expected to trade range-bound ahead of Friday's US Nonfarm Payroll report, moreover as Japanese markets will be closed until then, due to the Golden Week holidays. In the meantime, the pair retains the bearish tone seen on previous updates, with the technical indicators having corrected extreme oversold conditions in the 1 hour chart, but lacking directional strength, and the 4 hours chart showing that the Momentum indicator resumed its decline below the 100 level and the RSI consolidates around 26. Should the decline extend beyond 106.10, the immediate support, the pair will likely extend down to 105.00, as investors seem determinate to test BOJ's line in the sand.
Support levels: 106.10 101.75 101.40
Resistance levels: 106.90 107.35 107.80
AUD/USD Current price: 0.7655
View Live Chart for the AUD/USD
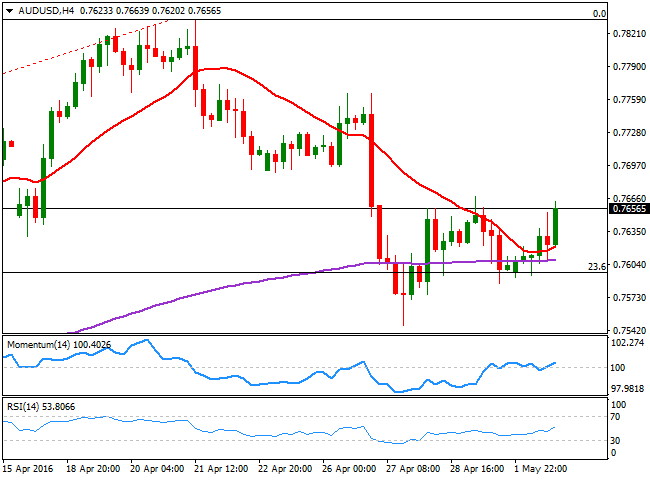
The Australian dollar bounced again from the 0.7600 region against the greenback, advancing up to 0.7663 intraday, on the back of dollar's weakness and a sharp advance in gold prices. The AUD/USD pair, however, saw a limited rally ahead of the upcoming RBA decision, due at 04:30 GMT this Tuesday. The Reserve Bank of Australia has been largely expected to remain on hold, until the release of the first quarter inflation figures last week. Core inflation fell to its lowest in over 15 years, triggering speculation that the Central Bank may cut rates, particularly to prevent further Aussie appreciation. Expectations are of an on-hold stance and indeed, a rate cut may see the AUD/USD pair finally breaking lower. Nevertheless, the technical picture is mild bullish at the time being, as in the 4 hours chart, the price holds near the mentioned high after advancing above its 20 SMA and the 200 EMA, whilst the technical indicators head north after bouncing from their mid-lines.
Support levels: 0.7600 0.7570 0.7540
Resistance levels: 0.7660 0.7700 0.7745
Information on these pages contains forward-looking statements that involve risks and uncertainties. Markets and instruments profiled on this page are for informational purposes only and should not in any way come across as a recommendation to buy or sell in these assets. You should do your own thorough research before making any investment decisions. FXStreet does not in any way guarantee that this information is free from mistakes, errors, or material misstatements. It also does not guarantee that this information is of a timely nature. Investing in Open Markets involves a great deal of risk, including the loss of all or a portion of your investment, as well as emotional distress. All risks, losses and costs associated with investing, including total loss of principal, are your responsibility. The views and opinions expressed in this article are those of the authors and do not necessarily reflect the official policy or position of FXStreet nor its advertisers. The author will not be held responsible for information that is found at the end of links posted on this page.
If not otherwise explicitly mentioned in the body of the article, at the time of writing, the author has no position in any stock mentioned in this article and no business relationship with any company mentioned. The author has not received compensation for writing this article, other than from FXStreet.
FXStreet and the author do not provide personalized recommendations. The author makes no representations as to the accuracy, completeness, or suitability of this information. FXStreet and the author will not be liable for any errors, omissions or any losses, injuries or damages arising from this information and its display or use. Errors and omissions excepted.
The author and FXStreet are not registered investment advisors and nothing in this article is intended to be investment advice.
Recommended Content
Editors’ Picks
EUR/USD edges lower toward 1.0700 post-US PCE

EUR/USD stays under modest bearish pressure but manages to hold above 1.0700 in the American session on Friday. The US Dollar (USD) gathers strength against its rivals after the stronger-than-forecast PCE inflation data, not allowing the pair to gain traction.
GBP/USD retreats to 1.2500 on renewed USD strength

GBP/USD lost its traction and turned negative on the day near 1.2500. Following the stronger-than-expected PCE inflation readings from the US, the USD stays resilient and makes it difficult for the pair to gather recovery momentum.
Gold struggles to hold above $2,350 following US inflation

Gold turned south and declined toward $2,340, erasing a large portion of its daily gains, as the USD benefited from PCE inflation data. The benchmark 10-year US yield, however, stays in negative territory and helps XAU/USD limit its losses.
Bitcoin Weekly Forecast: BTC’s next breakout could propel it to $80,000 Premium

Bitcoin’s recent price consolidation could be nearing its end as technical indicators and on-chain metrics suggest a potential upward breakout. However, this move would not be straightforward and could punish impatient investors.
Week ahead – Hawkish risk as Fed and NFP on tap, Eurozone data eyed too

Fed meets on Wednesday as US inflation stays elevated. Will Friday’s jobs report bring relief or more angst for the markets? Eurozone flash GDP and CPI numbers in focus for the Euro.