EUR/USD Current Price: 1.1298
View Live Chart for the EUR/USD
The American dollar plummeted after the Federal Reserve Chair Janet Yellen said that U.S. central bankers should be cautious in raising interest rates, and that, in spite core inflation seems to be rising, is yet to see if the latest recovery "will prove durable." She also added that the FED has "considerable scope for stimulus if needed." A dovish tone from Yellen should not have came as a surprise, but it was, given the hawkish tone of FED's officers during the past week. The greenback was trading mixed ahead of the event, finding some limited support in weaker commodities' prices and better-than-expected US data, as the Conference Board Consumer Confidence Index improved in March, up to 96.2 up from 94.0 in February.
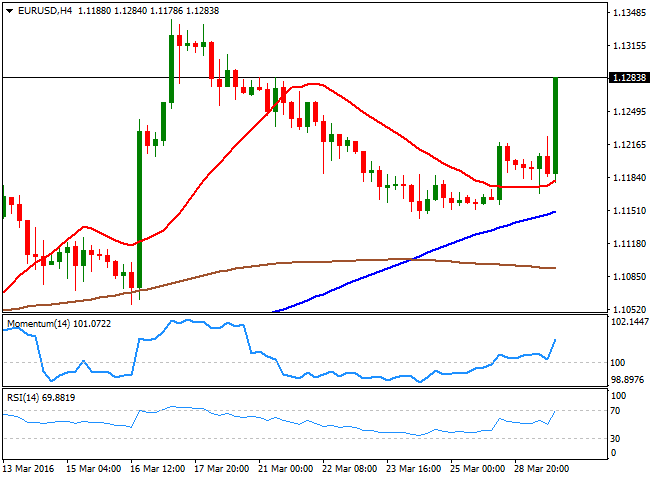
But Yellen sealed dollar's destiny, and sent the EUR/USD pair up to the 1.1300 region, trespassing last week´s high, and therefore indicating a strong upward potential for the upcoming sessions. A rate hike in the US is now is unlikely until at least September, and the dollar will pay the price, probably by sinking further across the board. As for the technical picture of the pair, the 4 hours chart shows that the technical indicators are entering overbought territory by the end of the US session, as the price remains pressuring the highs, all of which supports a continued advance towards the 1.1340 level, this month high, en route to 1.1375, the year high. Should the price extend beyond this last, the rally can extend up to 1.1460, a major static resistance level that contained the pair since early 2015.
Support levels: 1.1245 1.1190 1.1140
Resistance levels: 1.1340 1.1375 1.1420
EUR/JPY Current price: 127.28
View Live Chart for the EUR/JPY
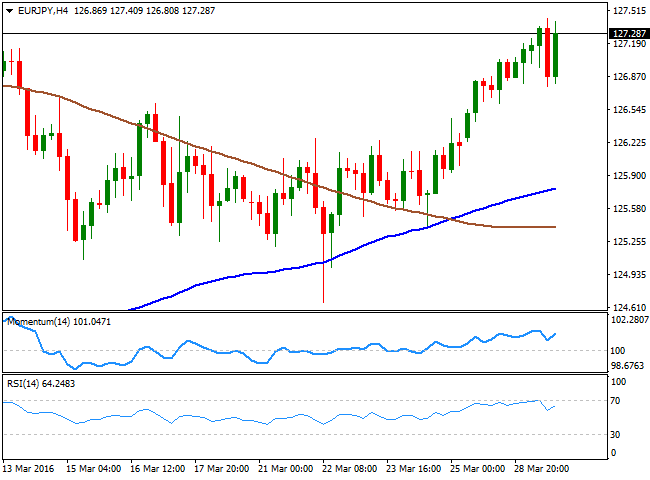
The EUR/JPY pair trades at its highest since mid February, up to 127.44 during the American afternoon, as the common currency got a boost from Yellen's wording. The Japanese yen suffered during the past Asian session, as PM Abe spoke before the Diet, dissipating rumors of a sales tax increase postponement, scheduled for April 2017. The Yen regained some ground against the greenback, but for the EUR/JPY the risk will remain towards the downside, as Yellen's words sent stocks skyrocketing, something that should prevent the JPY from appreciating further. Technically, the 1 hour chart for the EUR/JPY pair supports additional gains, given that the price is well above its 100 and 200 SMAs, while the technical indicators aim higher above their mid-lines. In the 4 hours chart, the technical indicators resumed their advances within positive territory and with the RSI indicator having corrected overbought readings, all of which supports a continued rally up to 128.60, a strong static resistance level.
Support levels: 127.00 126.65 126.05
Resistance levels: 127.80 128.60 129.10
GBP/USD Current price: 1.4395
View Live Chart for the GBP/USD
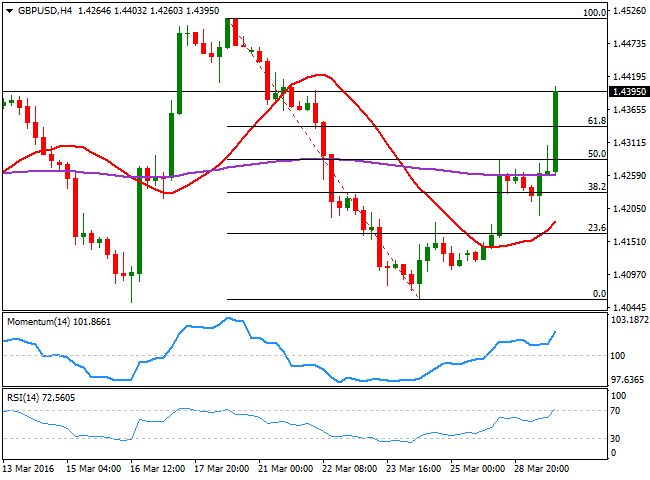
The GBP/USD pair rallied this Tuesday up to 1.4403, the highest for the week on broad dollar's weakness, albeit the advance began earlier in the day, with no actual catalyst beyond the movement, but some follow through of Monday's gains. The pair traded as low as 1.4193 at the beginning of the London session, from where a sharp bounce was triggered, in spite of BOE's Financial Stability Report saying that the economy's outlook has worsened since it last report in November. That early bounce suggests that Brexit's fears have, somehow diminished, and that the Sterling may keep rallying, particularly now that the market is determinate to sell the greenback. The 4 hours chart shows that the price is back above its 200 EMA, which provided support ever since the US session started, whilst the technical indicators maintain strong bullish slopes near overbought levels, supporting a retest of this March high at 1.4513.
Support levels: 1.4335 1.4290 1.4250
Resistance levels: 1.4410 1.4460 1.4515
USD/JPY Current price: 112.78
View Live Chart for the USD/JPY
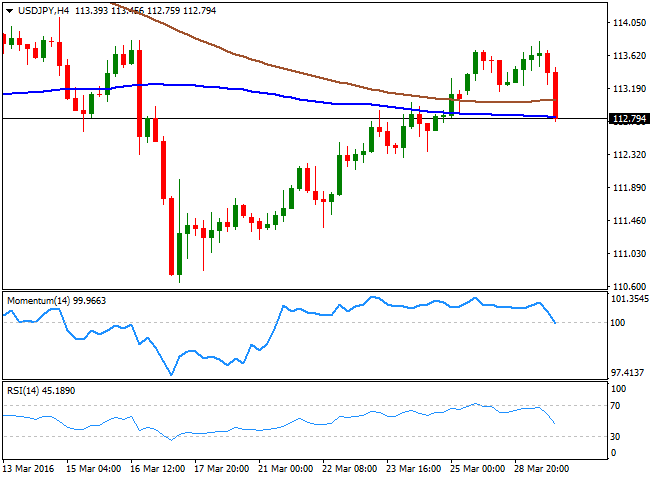
After posting a fresh two-week high of 113.79, the USD/JPY pair plunged over 100 pips, as FED's Yellen down-talked the possibility of a soon to come rate hike in the US. The Japanese yen was hit during Asian hours, as local retail sales fell a whopping 2.3% in February, while the unemployment rate during the same month surged to 3.3%, above the 3.2% expected. Also, and alongside with the approval of the budget for FY2016 in the upper house, PM Abe said that he is not intending to delay the planned sales tax, given that the economic fundamentals for the country are sound. The USD/JPY pair in its hourly chart, is now presenting a strong bearish tone, given that the technical indicators keep heading south, despite being in oversold territory, while the price has broken below its 100 SMA, now the immediate resistance around 113.05. In the 4 hours chart, the price has extended below its 100 and 200 SMAs, whilst the technical indicators are currently crossing below their mid-lines almost vertically, indicating further slides are yet to be seen.
Support levels: 112.40 111.90 111.50
Resistance levels: 113.05 113.35 113.70
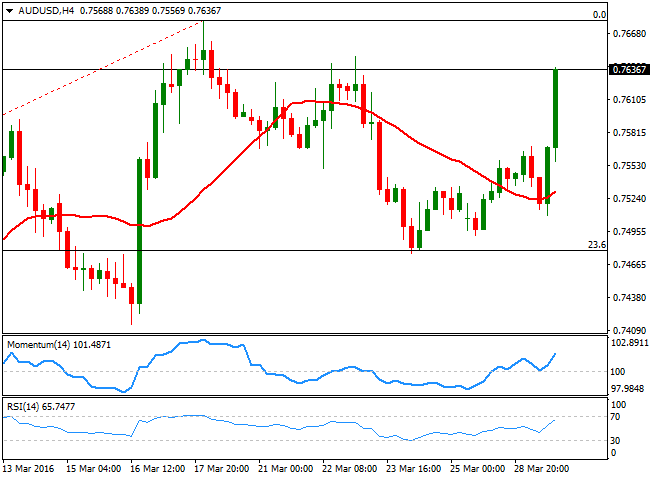
AUD/USD Current price: 0.7636
View Live Chart for the AUD/USD
The Australian dollar regained the ground lost last week against the greenback, and is back on its bullish track, having began to run even before Janet Yellen’s speech, as gold broke above the key $1,225.00 a troy ounce level, late in the London session, triggering stops and supporting the commodity-correlated currency. Trading roughly 50 pips away from the multi-month high posted this March, the AUD/USD pair is poised to extend its rally, with the market now looking for fresh highs beyond the 0.7700 figure. Short term, the 1 hour chart shows that the technical indicators are losing partially bullish strength within extreme overbought territory, but as the price remains around the daily high, chances of a downward corrective move are very limited. In the 4 hours chart, the price has advanced sharply above a now bullish 20 SMA, while the technical indicators have also lost upward potential, but remain near overbought levels, and with no signs of turning lower, suggesting some consolidation before a new leg north.
Support levels: 0.7610 0.7570 0.7525
Resistance levels: 0.7680 0.7720 0.7765
Information on these pages contains forward-looking statements that involve risks and uncertainties. Markets and instruments profiled on this page are for informational purposes only and should not in any way come across as a recommendation to buy or sell in these assets. You should do your own thorough research before making any investment decisions. FXStreet does not in any way guarantee that this information is free from mistakes, errors, or material misstatements. It also does not guarantee that this information is of a timely nature. Investing in Open Markets involves a great deal of risk, including the loss of all or a portion of your investment, as well as emotional distress. All risks, losses and costs associated with investing, including total loss of principal, are your responsibility. The views and opinions expressed in this article are those of the authors and do not necessarily reflect the official policy or position of FXStreet nor its advertisers. The author will not be held responsible for information that is found at the end of links posted on this page.
If not otherwise explicitly mentioned in the body of the article, at the time of writing, the author has no position in any stock mentioned in this article and no business relationship with any company mentioned. The author has not received compensation for writing this article, other than from FXStreet.
FXStreet and the author do not provide personalized recommendations. The author makes no representations as to the accuracy, completeness, or suitability of this information. FXStreet and the author will not be liable for any errors, omissions or any losses, injuries or damages arising from this information and its display or use. Errors and omissions excepted.
The author and FXStreet are not registered investment advisors and nothing in this article is intended to be investment advice.
Recommended Content
Editors’ Picks
EUR/USD edges lower toward 1.0700 post-US PCE

EUR/USD stays under modest bearish pressure but manages to hold above 1.0700 in the American session on Friday. The US Dollar (USD) gathers strength against its rivals after the stronger-than-forecast PCE inflation data, not allowing the pair to gain traction.
GBP/USD retreats to 1.2500 on renewed USD strength

GBP/USD lost its traction and turned negative on the day near 1.2500. Following the stronger-than-expected PCE inflation readings from the US, the USD stays resilient and makes it difficult for the pair to gather recovery momentum.
Gold struggles to hold above $2,350 following US inflation

Gold turned south and declined toward $2,340, erasing a large portion of its daily gains, as the USD benefited from PCE inflation data. The benchmark 10-year US yield, however, stays in negative territory and helps XAU/USD limit its losses.
Bitcoin Weekly Forecast: BTC’s next breakout could propel it to $80,000 Premium

Bitcoin’s recent price consolidation could be nearing its end as technical indicators and on-chain metrics suggest a potential upward breakout. However, this move would not be straightforward and could punish impatient investors.
Week ahead – Hawkish risk as Fed and NFP on tap, Eurozone data eyed too

Fed meets on Wednesday as US inflation stays elevated. Will Friday’s jobs report bring relief or more angst for the markets? Eurozone flash GDP and CPI numbers in focus for the Euro.
