EUR/USD Current price: 1.0881
View Live Chart for the EUR/USD
The dollar ended the day firmer against the common currency, with better-than-expected US data sending the pair below the 1.0900 mark in the American afternoon. Personal income increased $44.4 billion, or 0.3%, in November, while personal consumption expenditures increased $40.1 billion, also a 0.3% advance according to the Bureau of Economic Analysis. In the same month, Real PCE increased 0.3% percent, in contrast to a decrease of less than 0.1% in October. The core PCE, resulted at 1.3% matching the previous month reading. Also supporting the greenback and following a strong 2.9 gain in October, durable goods orders remained flat in November as core capital goods fell for the second straight month, beating expectations of a 0.7 decline. Finally, the University of Michigan’s measure of consumer sentiment rose to 92.6, a five-month high.
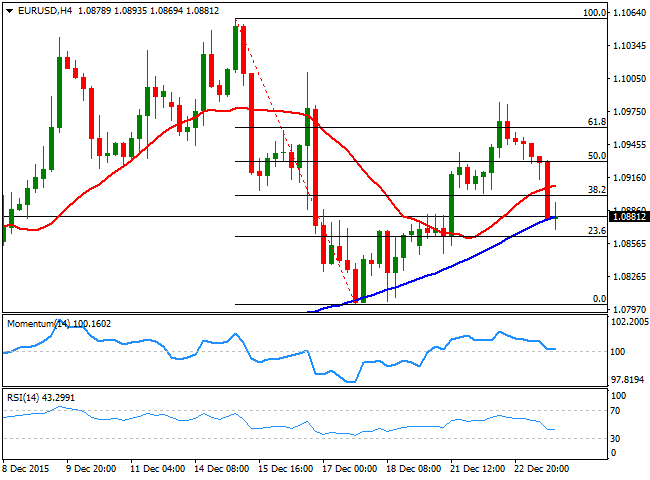
Markets are expected to offer little this Thursday, with German markets closed and the US closing earlier ahead of the Christmas holidays that will keep most markets closed on Friday. Reduced, choppy trading is expected to extend into the new year, as the upcoming week will also saw an empty calendar and shortened 3-day week. In the meantime, the EUR/USD pair seems ready to extend its decline, given that the latest upward rally stalled around the 61.8% retracement of the December monthly decline. In the 4 hours chat, the price is now below a mild bullish 20 SMA, whilst the technical indicators have turned flat around their mid-lines, suggesting limited bearish strength at the time being.
Support levels: 1.0860 1.0820 1.0770
Resistance levels: 1.0920 1.0955 1.0990
EUR/JPY Current price: 132.69
View Live Chart for the EUR/JPY
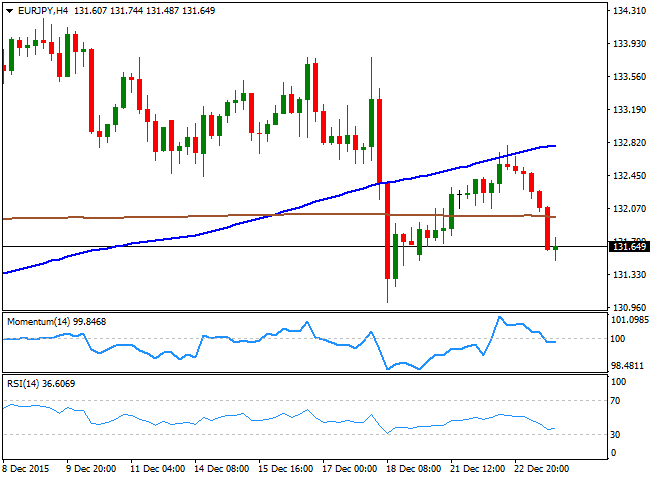
The EUR/JPY pair shed all of its weekly gains amid a weakening EUR, whilst the JPY held to its recent gains triggered by the BOJ last week. The daily chart for the EUR/JPY shows that the price has extended further below a bearish 100 DMA, while the technical indicators are reaching lower lows within bearish territory, all of which maintains the risk towards the downside. Shorter term, the 1 hour chart shows that the technical indicators are aiming to correct higher from oversold territory, but that the price remains well below the 100 and 200 SMAs, with the shortest around 132.15, providing a strong intraday resistance during the upcoming hours. In the 4 hours chart, the price develops below its moving averages, albeit the 100 SMA continues heading higher above the 200 SMA, while the technical indicators have turned flat in negative territory, limiting the possibility of a strong decline.
Support levels: 131.40 130.90 130.50
Resistance levels: 132.15 132.60 133.10
GBP/USD Current price: 1.4866
View Live Chart for the GPB/USD
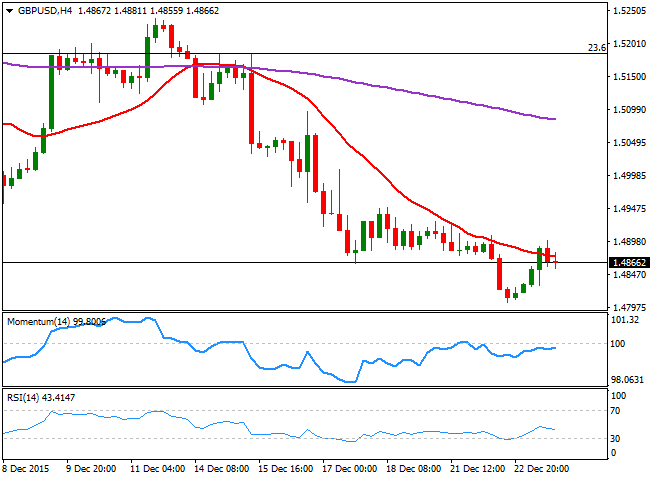
The GBP/USD pair turned higher this Wednesday, but faltered ahead of the 1.4900 figure, retreating from a daily high set at 1.4899. Holding into gains, the Pound advanced, despite the UK Q3 GDP was finally revised down to 2.1% y/y from the expected reading of 2.3%. The UK also reported Q3 current account at -GBP17.5 B vs. -GBP21.5B consensus. The intraday upward move came after a decline of eight days in-a-row and ahead of the holidays, clearly being triggered by profit taking and position adjustments. From a technical point of view, the downside is still favored, as in the 4 hours chart, the pair is unable to advance above its 20 SMA, while the technical indicators have recovered from overbought territory and continue heading north, but below their mid-lines. The level to watch during the upcoming sessions is the 1.4950 resistance, as only a steady advance above it would lead to a more steadier recovery during the following days.
Support levels: 1.4835 1.4790 1.4760
Resistance levels: 1.4890 1.4920 1.4950
USD/JPY Current price: 120.85
View Live Chart for the USD/JPY
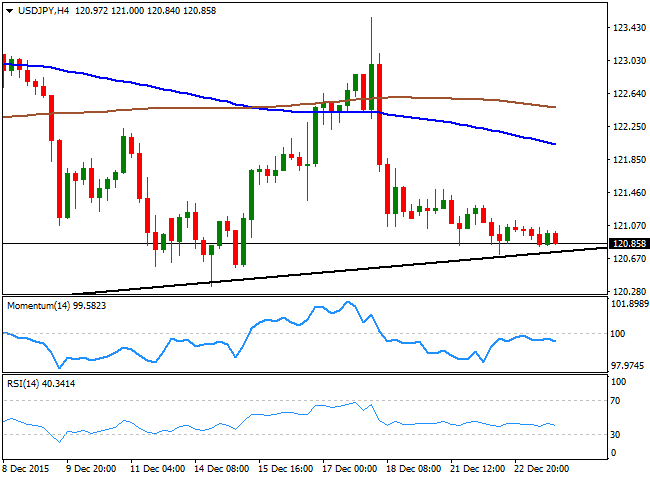
The USD/JPY pair remained confined within a tight range this Wednesday, although closed the day below the 121.00 level, having been trading in the red ever since the day started. The pair is trading a few pips above a daily ascendant trend line coming from 116.13 the low set past August 24th, currently at 120.65, the immediate support, and the daily chart shows that the price is below its 100 DMA, whilst the technical indicators have extended their declines below their mid-lines. For the short term, the 1 hour chart presents a neutral-to-bearish stance, as the technical indicators have turned slightly lower below their mid-lines, whilst the price develops below its 100 and 200 SMAs. In the 4 hours chart the technical indicators are resuming their declines below their mid-lines as the price remains well below their moving averages, in line with the shorter term outlook.
Support levels: 120.65 120.35 119.90
Resistance levels: 121.00 121.40 121.70
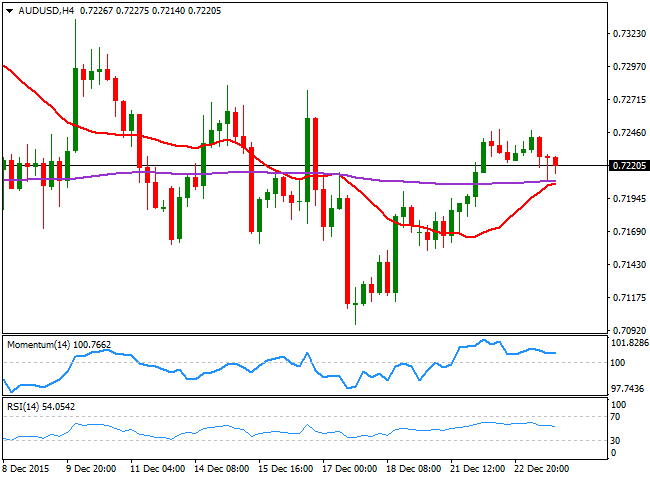
AUD/USD Current price: 0.7220
View Live Chart for the AUD/USD
The Australian dollar ended the day with some limited losses against the greenback, having been unable to settle beyond the 0.7240 strong static resistance level. The Aussie was weighed by a retracement in gold prices, although the daily decline was limited by buying interest surging on approaches to the 0.7200 level. From a technical point of view the 1 hour chart shows that the price is below its 20 SMA, while the technical indicators aim slightly higher around their mid-lines, for the most, presenting a neutral stance. In the 4 hours chart, the upside is still favored with the price above a bullish 20 SMA and above the 200 EMA, and the technical indicators holding ground well above their mid-lines, although lacking directional strength.
Support levels: 0.7200 0.7165 0.7120
Resistance levels: 0.7240 0.7280 0.7330
Information on these pages contains forward-looking statements that involve risks and uncertainties. Markets and instruments profiled on this page are for informational purposes only and should not in any way come across as a recommendation to buy or sell in these assets. You should do your own thorough research before making any investment decisions. FXStreet does not in any way guarantee that this information is free from mistakes, errors, or material misstatements. It also does not guarantee that this information is of a timely nature. Investing in Open Markets involves a great deal of risk, including the loss of all or a portion of your investment, as well as emotional distress. All risks, losses and costs associated with investing, including total loss of principal, are your responsibility. The views and opinions expressed in this article are those of the authors and do not necessarily reflect the official policy or position of FXStreet nor its advertisers. The author will not be held responsible for information that is found at the end of links posted on this page.
If not otherwise explicitly mentioned in the body of the article, at the time of writing, the author has no position in any stock mentioned in this article and no business relationship with any company mentioned. The author has not received compensation for writing this article, other than from FXStreet.
FXStreet and the author do not provide personalized recommendations. The author makes no representations as to the accuracy, completeness, or suitability of this information. FXStreet and the author will not be liable for any errors, omissions or any losses, injuries or damages arising from this information and its display or use. Errors and omissions excepted.
The author and FXStreet are not registered investment advisors and nothing in this article is intended to be investment advice.
Recommended Content
Editors’ Picks
EUR/USD edges lower toward 1.0700 post-US PCE

EUR/USD stays under modest bearish pressure but manages to hold above 1.0700 in the American session on Friday. The US Dollar (USD) gathers strength against its rivals after the stronger-than-forecast PCE inflation data, not allowing the pair to gain traction.
GBP/USD retreats to 1.2500 on renewed USD strength

GBP/USD lost its traction and turned negative on the day near 1.2500. Following the stronger-than-expected PCE inflation readings from the US, the USD stays resilient and makes it difficult for the pair to gather recovery momentum.
Gold struggles to hold above $2,350 following US inflation

Gold turned south and declined toward $2,340, erasing a large portion of its daily gains, as the USD benefited from PCE inflation data. The benchmark 10-year US yield, however, stays in negative territory and helps XAU/USD limit its losses.
Bitcoin Weekly Forecast: BTC’s next breakout could propel it to $80,000 Premium

Bitcoin’s recent price consolidation could be nearing its end as technical indicators and on-chain metrics suggest a potential upward breakout. However, this move would not be straightforward and could punish impatient investors.
Week ahead – Hawkish risk as Fed and NFP on tap, Eurozone data eyed too

Fed meets on Wednesday as US inflation stays elevated. Will Friday’s jobs report bring relief or more angst for the markets? Eurozone flash GDP and CPI numbers in focus for the Euro.
