EUR/USD Current price: 1.0983
View Live Chart for the EUR/USD
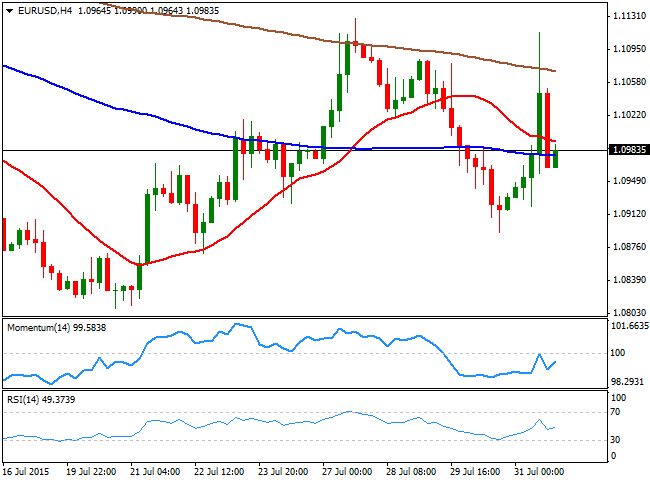
The American dollar closed the week pretty much unchanged against most of its majors rivals, with only the British Pound posting some solid gains against the greenback. As for the EUR/USD pair, the weekly chart shows that, despite unchanged from its opening, the pair has managed to post a lower high at 1.0892, and a higher high of 1.1128. The dollar traded generally stronger, but on Friday, the release of US quarterly wage and costs numbers sent the currency sharply lower. The data it's not often a big market mover, but given that wages rose at it slowest pace since the records began in 1982, and ahead of the upcoming Payrolls data, investors rushed to profit out of the greenback. During the weekend, news coming from Europe suggests that the initial deadline for a Greek bailout of August 20th may be delayed once again, but it will hardly affect the market. In the US, FED's Bullard said in an interview that the Central Bank is "in good shape" to hike rates in September, but investors may prefer to wait for the US NFP release next Friday, to begin pricing that in.
Technically, the EUR/USD 4 hours chart maintains a mild bearish tone with the price below its 20 SMA and the technical indicators aiming higher, but below their mid-lines. Nevertheless, there's no clear directional strength at the time being, but the long term dominant bearish trend remains intact as the pair met strong selling interest in the 1.1120 region, a long term strong static resistance level, and even fell below 1.1000 before closing the week, which suggests further declines are likely, particularly on strong US data. In the short term, the immediate support stands at 1.0950, with a break below it exposing the pair to a retest of the low around 1.0890, whilst selling interest may likely surge on approaches to the 1.1050 price zone.
Support levels: 1.0950 1.0920 1.0890
Resistance levels: 1.1000 1.1050 1.1080
EUR/JPY Current Price: 136.04
View Live Chart for the EUR/JPY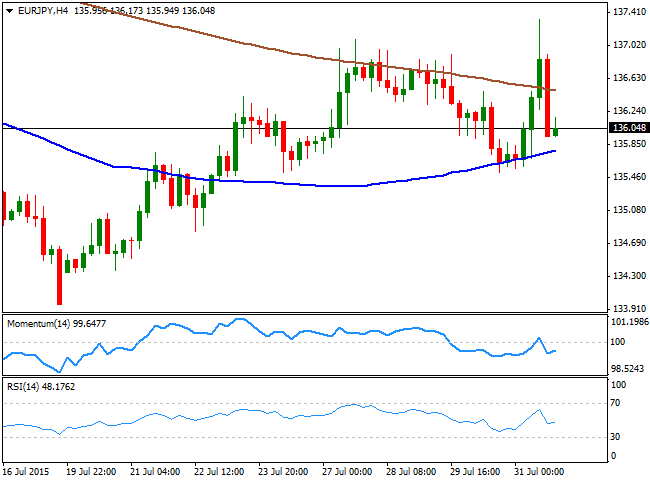
The EUR/JPY erased most of its weekly gains, closing last week around the 136.00 level, weighed by a weaker EUR and a mostly flat Japanese yen. The daily chart for the pair shows that it held above its 200 SMA, currently around 135.50, and providing an immediate support, whilst the technical indicators maintain a neutral stance, stuck around their mid-lines. In the shorter term, the 4 hours chart presents a neutral-to-bearish stance, with the price contained between is 100 and 200 SMAs, and the technical indicators lacking directional strength below their mid-lines. For much of July, selling interest has surged on spikes beyond the 137.00 level, and seems unlikely the pair will break above it during the firsts days of next week, so approaches to it should be consider selling opportunities. A break below the mentioned weekly low, on the other hand, should fuel the slide towards the 134.60 price zone.
Support levels: 135.50 135.10 134.60
Resistance levels: 135.90 136.60 137.10
GBP/USD Current price: 1.5623
View Live Chart for the GPB/USD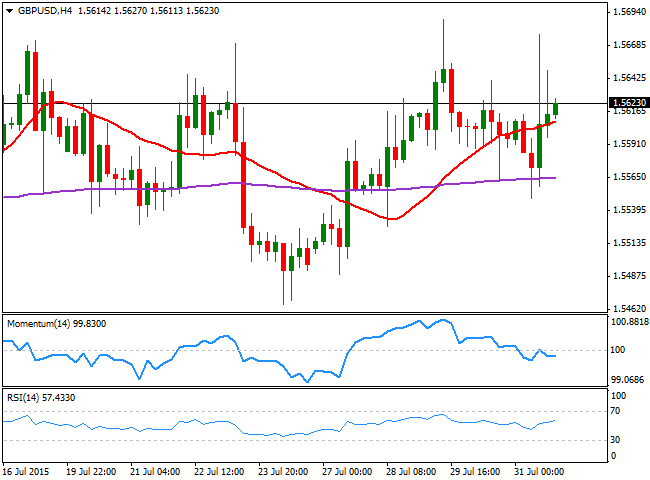
The British Pound has managed to advance beyond the 1.5600 level against its American rival, as any of dollar strength is being related to the chances of an upcoming rate hike, and ever since some of the MPC members have suggested that a rate hike in the UK is coming closer, Pound's strength has equal dollar's one. During the next week, the BOE will have its monthly economic meeting, and the Minutes will be released alongside, and not two-weeks later as it was until last month. Expectations are for some MCP members voting for a rate hike, which should boost the Pound. In the meantime, the 4 hours chart shows that the price is above its 20 SMA, and above the 200 EMA, this last, flat around 1.5560. In the same chart, the Momentum indicator heads slightly lower below its mid-line, rather reflecting the late range than suggesting a downward move, whilst the RSI indicator aims north around 57. For this Monday, the level to watch is 1.5670, as only a clear advance above it should favor additional intraday gains up to 1.5730.
Support levels: 1.5600 1.5560 1.5520
Resistance levels: 1.5670 1.5730 1.5770
USD/JPY Current price: 123.79
View Live Chart for the USD/JPY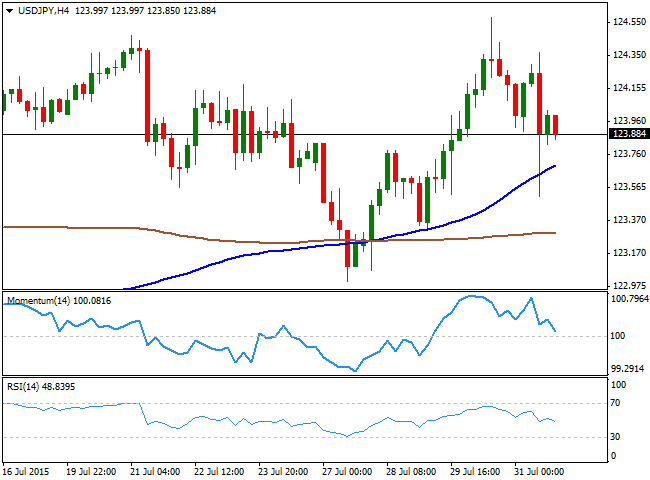
The USD/JPY pair closed the week in the red, but remains trading in a tight 100 PIPS range, consolidating around the 124.00 level. During the weekend, BOJ's Governor Kuroda gave an interview to a local newspaper, saying that, despite there is no immediate need for additional easing, the Central Bank is ready to act if needed. He is still confident that inflation will continue picking up, an accelerate by the first quarter of 2016. The news should barely affect the currency at this point, and the pair will likely continue trading range bound ahead of US employment data on Friday. The range is being limited by buyers in the 123.30 level and selling interest around 124.45. Daily basis, the technical indicators have turned south and are about to cross their mid-lines towards the downside, but the pair stands well above its moving averages. In the 4 hours chart, the price is also above their moving averages, a few pips below the current level, whilst the technical indicators are crossing their mid-lines towards the downside, increasing the risk of a bearish move for this Monday.
Support levels: 123.70 123.30 122.90
Resistance levels: 124.10 124.45 124.90
AUD/USD Current price: 0.7306
View Live Chart for the AUD/USD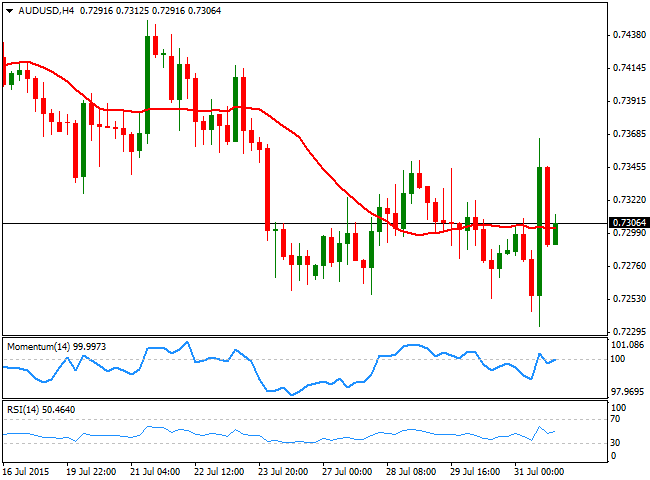
The AUD/USD pair fell down to a fresh 6-year low of 0.7233 on Friday, before retaking the 0.7300 level on the back of poor wages data in the US. The Aussie also found support in gold's recovery, as the commodity jumped around $15.00 after the news. Nevertheless, the intraday recovery extended up to 0.7366, but the overall bearish trend prevailed, with the pair now barely holding above the 0.7300 figure. In Australian, inflation and housing data will be released early Monday, which may set the tone for the pair. In the meantime, the 4 hours chart shows that the price hovers around a horizontal 20 SMA, whilst the technical indicators are showing no actual strength around their mid-lines. In the daily chart, the pair has been rejected from its 20 SMA around the mentioned high, whilst the technical indicators are posting limited bounces from oversold levels, suggesting upward movements will likely be understood as corrective, and therefore continue attracting sellers.
Support levels: 0.7290 0.7250 0.7220
Resistance levels: 0.7320 0.7350 0.7390
Recommended Content
Editors’ Picks
EUR/USD edges lower toward 1.0700 post-US PCE

EUR/USD stays under modest bearish pressure but manages to hold above 1.0700 in the American session on Friday. The US Dollar (USD) gathers strength against its rivals after the stronger-than-forecast PCE inflation data, not allowing the pair to gain traction.
GBP/USD retreats to 1.2500 on renewed USD strength

GBP/USD lost its traction and turned negative on the day near 1.2500. Following the stronger-than-expected PCE inflation readings from the US, the USD stays resilient and makes it difficult for the pair to gather recovery momentum.
Gold struggles to hold above $2,350 following US inflation

Gold turned south and declined toward $2,340, erasing a large portion of its daily gains, as the USD benefited from PCE inflation data. The benchmark 10-year US yield, however, stays in negative territory and helps XAU/USD limit its losses.
Bitcoin Weekly Forecast: BTC’s next breakout could propel it to $80,000 Premium

Bitcoin’s recent price consolidation could be nearing its end as technical indicators and on-chain metrics suggest a potential upward breakout. However, this move would not be straightforward and could punish impatient investors.
Week ahead – Hawkish risk as Fed and NFP on tap, Eurozone data eyed too

Fed meets on Wednesday as US inflation stays elevated. Will Friday’s jobs report bring relief or more angst for the markets? Eurozone flash GDP and CPI numbers in focus for the Euro.