EUR/USD Current price: 1.1052
View Live Chart for the EUR/USD
Financial markets have struggled once again with the increasing risk of a Grexit, after the Greek referendum ended with the "no" victory. The initial demand for safe-havens' yen and dollar, was partially reverted during the European morning, on hopes Athens will have some extra leverage in its negotiations with the Troika. However, the unexpected resignation of Finance Minister Yanis Varoufakis, and news that the "new" proposal from Tsipras is pretty much what Junker offered last June, put the market back in risk-off mode. In the meantime, chances of a sooner deal are quite unlikely, and without new funding, the Greek banks may have to increase their capital controls. Also, the ECB decided to maintain its emergency liquidity assistance unchanged at June 26th level. The greenback lost ground mid American session, as the Markit non-manufacturing PMI showed the slowest rise in the US service sector for five months in June, printing 54.8.
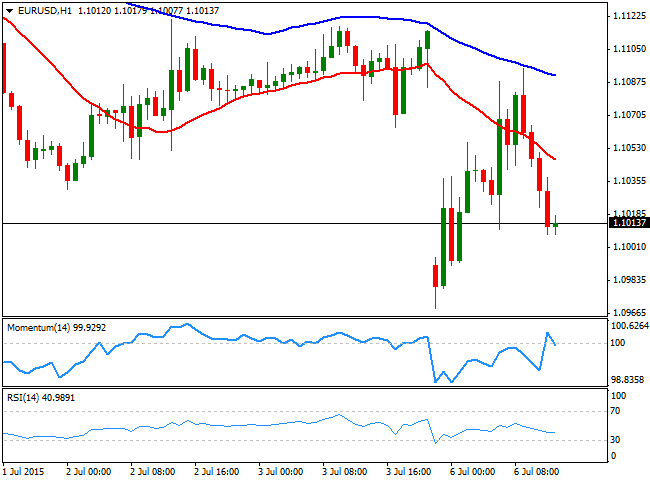
The EUR/USD pair flirted with the 1.1100 figure a couple of times during the day, but strong selling interest rejected the price, sending it back towards the 1.1050 region where it stands by the end of the US session. The short term picture favors the downside, as the price was unable to advance beyond its 100 SMA in the hourly chart, where indicators are now turning lower in neutral territory. In the 4 hours chart, the price remained capped by a bearish 20 SMA, whilst the technical indicators present tepid bearish slopes below their mid-lines, all of which supports additional declines for the upcoming sessions.
Support levels: 1.1000 1.0955 1.0920
Resistance levels: 1.1090 1.1120 1.1160
EUR/JPY Current price: 135.32
View Live Chart for the EUR/JPY
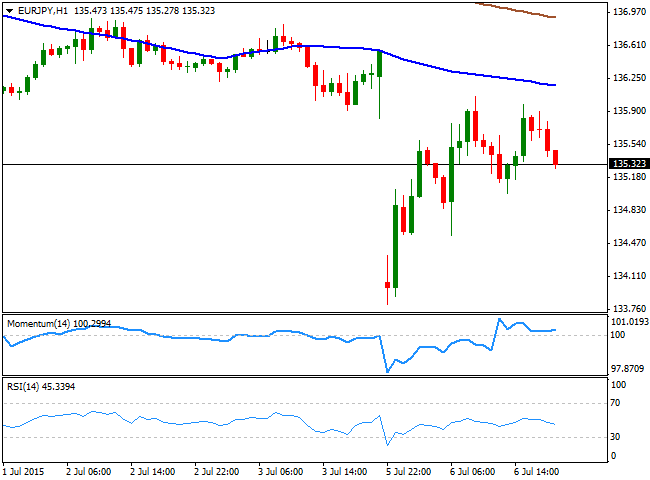
The EUR/JPY recovered up to 136.05 during Asian hours, with the yen weakening on BOJ's Kuroda wording over the local economic policy, remarking that quantitative easing will be maintained as long as it's needed, adding that the economic recovery is moderated, whilst inflation expectations remain subdued. The pair however, has been unable to hold to its gains, and closed the day a handful of pips above the 135.00 figure, with the 1 hour chart showing that the price stalled its recovery well below a bearish 100 SMA, currently around 136.10, whilst the technical indicators have stabilized in neutral territory after reaching extreme oversold readings with the weekly opening gap. In the 4 hours chart however, the technical bias is bearish, as the technical indicators head lower below their mid-lines, whilst the price stands well below its moving averages.
Support levels: 134.90 134.40 133.80
Resistance levels: 135.60 136.10 136.65
GBP/USD Current price: 1.5608
View Live Chart for the GBP/USD
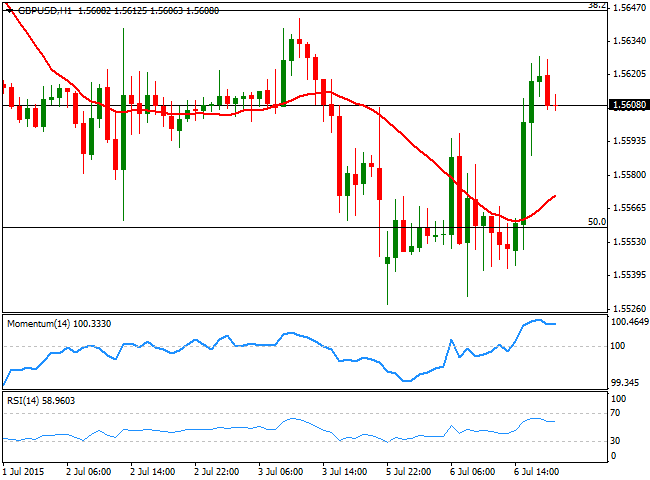
The British Pound managed to close the day with some limited gains against the greenback, after posting a fresh 3-week low with the weekly opening of 1.5527. The GBP/USD surged up to 1.5627 after the release of worse-than-expected US services data, as both, the Markit and the ISM non-manufacturing PMIs missed expectations. The UK will release its manufacturing and industrial production figures for May this Tuesday, and it the figures result positive, the Pound will likely continue attracting investors. In the meantime, the 1 hour chart for the pair shows that the price stands well above a mild bullish 20 SMA, whilst the technical indicators have corrected partially the overbought readings reached when peaking at the mentioned daily high, but maintain their upward tone. In the 4 hours chart, the price managed to recover above its 200 EMA and its 20 SMA, albeit the technical indicators have lost their upward strength around their mid-lines. The pair needs now to advance above 1.5645, the 38.2% retracement of its latest bullish run, to confirm another leg higher for this Tuesday.
Support levels: 1.5585 1.5550 1.5520
Resistance levels: 1.5645 1.5690 1.5730
USD/JPY Current price: 122.36
View Live Chart for the USD/JPY
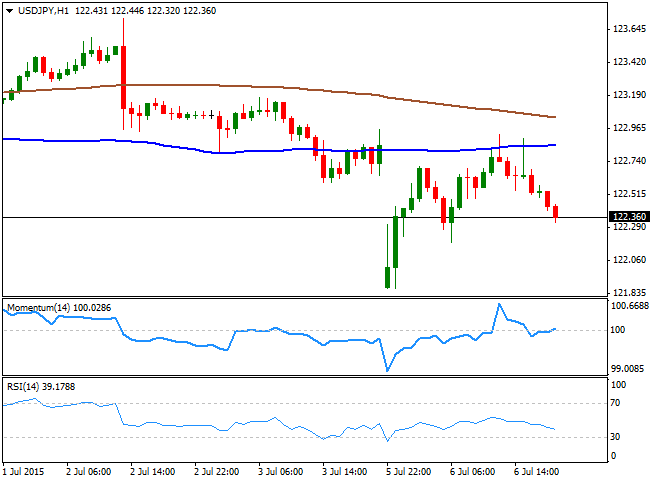
The Japanese Yen maintains part of its intraday gains against the greenback, as the pair approaches the 122.00 level by the US close, having already filled the weekly opening gap. The USD/JPY fell down to a fresh 1 -month low of 121.87 earlier in the day and was unable to advance beyond the 123.00 level on its intraday advances. The 1 hour chart shows that the price was rejected from its 100 SMA, now offering resistance in the 122.90 region, whilst the technical indicators are turning south below their mid-lines, maintaining the risk towards the downside. In the 4 hours chart, the 100 SMA is gaining bearish slope below the 200 SMA, whilst the RSI indicator heads strongly lower around 38, and the Momentum indicator hovers below the 100 level, supporting the longer term perspective. A break below 122.00 should lead to a downward extension towards 121.20, the 100 DMA.
Support levels: 122.00 121.60 121.20
Resistance levels: 122.45 122.95 123.30
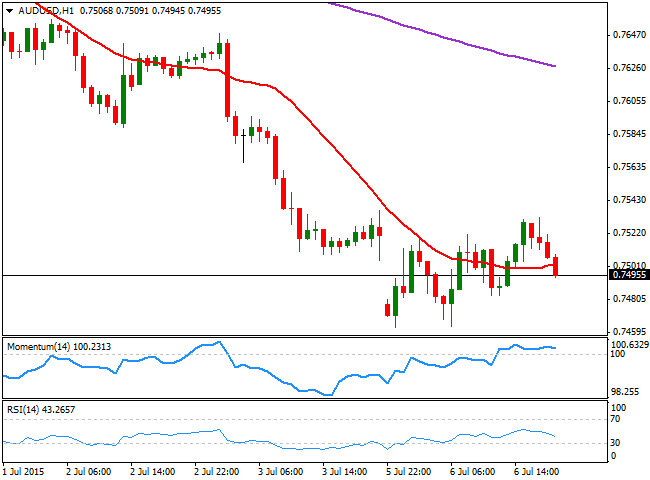
AUD/USD Current price: 0.7495
View Live Chart for the AUD/USD
The Australian dollar fell down to 0.7462 against the greenback, a fresh 6-year low, from where it managed to recover up to 0.7532 intraday, helped by a slight improvement in Australian TD Securities inflation figures for June, up to 1.5% compared to a year before, and weak US services data. Investors are now waiting for the RBA economic policy decision during the upcoming Asian session, albeit the Central Bank is expected to maintain its policy unchanged, something that may give the pair some intraday support. Technically, the 1 hour chart shows that the price is moving back and forth around a horizontal 20 SMA, whilst the technical indicators are turning lower around their mid-lines. In the 4 hours chart, the technical indicators have resumed their declines well into negative territory after correcting oversold readings, supporting a downward extension on a break below 0.7460, the immediate intraday support.
Support levels: 0.7460 0.7425 0.7380
Resistance levels: 0.7520 0.7555 0.7590
Recommended Content
Editors’ Picks
EUR/USD edges lower toward 1.0700 post-US PCE

EUR/USD stays under modest bearish pressure but manages to hold above 1.0700 in the American session on Friday. The US Dollar (USD) gathers strength against its rivals after the stronger-than-forecast PCE inflation data, not allowing the pair to gain traction.
GBP/USD retreats to 1.2500 on renewed USD strength

GBP/USD lost its traction and turned negative on the day near 1.2500. Following the stronger-than-expected PCE inflation readings from the US, the USD stays resilient and makes it difficult for the pair to gather recovery momentum.
Gold struggles to hold above $2,350 following US inflation

Gold turned south and declined toward $2,340, erasing a large portion of its daily gains, as the USD benefited from PCE inflation data. The benchmark 10-year US yield, however, stays in negative territory and helps XAU/USD limit its losses.
Bitcoin Weekly Forecast: BTC’s next breakout could propel it to $80,000 Premium

Bitcoin’s recent price consolidation could be nearing its end as technical indicators and on-chain metrics suggest a potential upward breakout. However, this move would not be straightforward and could punish impatient investors.
Week ahead – Hawkish risk as Fed and NFP on tap, Eurozone data eyed too

Fed meets on Wednesday as US inflation stays elevated. Will Friday’s jobs report bring relief or more angst for the markets? Eurozone flash GDP and CPI numbers in focus for the Euro.
