EUR/USD Current price: 1.1361
View Live Chart for the EUR/USD
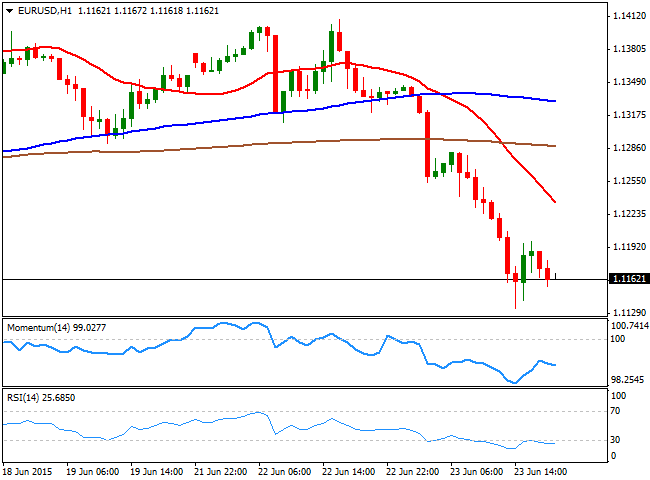
The EUR/USD pair fell down to a fresh 2-week low of 1.1134, despite a Greek deal is under way, and improved Eurozone economic growth. With the Greece problem out of the way, investors seem to have focused in the imbalance between economic policies between both economies, as whilst the ECB is buying €60bn per month, the FED has already announced at least two quarter point rate hikes in the way. In the meantime, European stocks surged strongly and yields eased from their latest highs, also reverting their last 3-weeks trend. In the US, data resulted mixed, as Durable Goods Orders for May resulted worse-than-expected, printing -1.8% against a 0.6% drop. Nevertheless, orders for business equipment rose, indicating demand for American-made manufactured goods is stabilizing. New Home sales however, rose the highest level in seven years, whilst the Markit Manufacturing PMI registered 53.4, the lowest reading since October 2013, but still above the 50 threshold that indicates economic expansion.
Technically, the pair has broken through several critical supports without looking back, and the short term picture suggests the EUR/USD can continue falling, as in the 1 hour chart, it has extended far below its moving averages, with the 20 SMA having crossed below the 100 and 200 SMAs, and now around 1.1230, whilst the technical indicators have resumed their declines after some limited corrections from oversold levels, well into negative territory. In the 4 hours chart, the Momentum indicator has accelerated toward the downside, whilst the RSI maintains its bearish slope near 32, and the 20 SMA has turned lower well above the current level, all of which supports additional declines particularly on a break below the 1.1120 level, a strong static support zone.
Support levels: 1.1120 1.1050 1.1010
Resistance levels: 1.1200 1.1245 1.1290
EUR/JPY Current price: 138.25
View Live Chart for the EUR/JPY
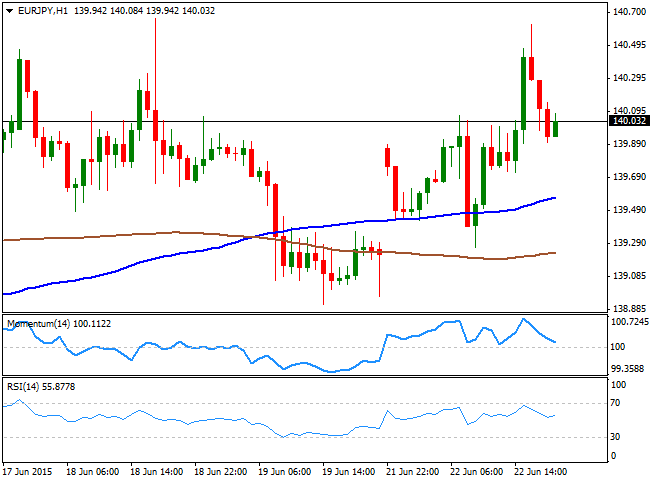
The EUR/JPY pair fell down to the base of these last 3-weeks range around the 138.00 level, as investors dumped the common currency. On Monday, the pair advanced up to 140.62, but failed to sustain gains above the 140.00 mark, resuming its decline early in the Asian session. The pair has been trading between 137.90 and 141.00 pretty much since June started, which means the range is still in place, albeit the risk towards the downside has increased exponentially. Short term, the 1 hour chart shows that the price broke below its 100 and 200 SMAs, with the shortest still above the largest, whilst the Momentum indicator heads sharply lower below the 100 level and the RSI is beginning to look exhausted towards the downside around 24. In the 4 hours chart, the price is now below its 100 SMA for the first time since late May, while the Momentum indicator heads slightly lower in neutral territory, but the RSI indicator anticipates additional declines around 35. Should the price break below 137.90, the bearish momentum will likely accelerate by triggering stops, signaling a probable downward continuation towards 135.95, May 18th daily high.
Support levels: 137.90 137.45 136.80
Resistance levels: 138.60 139.10 139.65
GBP/USD Current price: 1.5709
View Live Chart for the GBP/USD
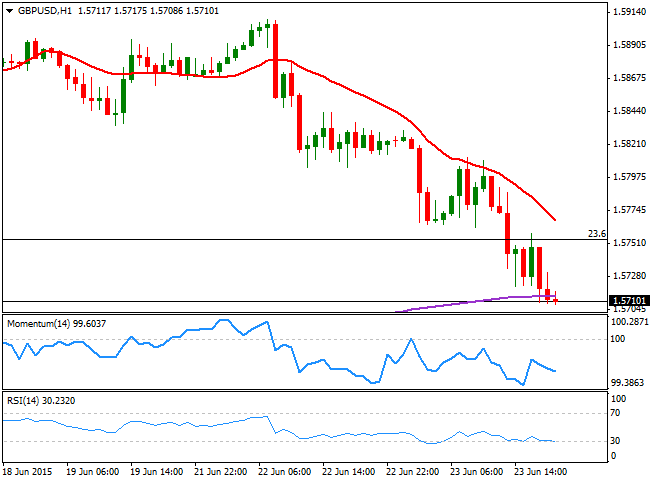
The British Pound trades at a fresh 6-day low against the greenback, a couple of pips above the 1.5700 level, weighed by broad dollar strength. Earlier in the day, data coming from the UK showed that a fall in export demand slowed the recovery in the UK’s manufacturing sector in June, according to the CBI Industrial Trends Survey. The GBP/USD pair broke below the 23.6% retracement of its latest bullish run between 1.5189 and 1.5292, maintaining the bearish bias in the short term, as the 1 hour chart shows that the price remains capped below a bearish 20 SMA, currently around 1.5770, whilst the technical indicators maintain their negative tone near oversold levels. In the 4 hours chart, the Momentum indicator heads sharply lower below the 100 level, whilst the RSI also heads down near 39, supporting further declines, towards the 1.5650 level, 38.2% retracement of the same rally.
Support levels: 1.5700 1.5650 1.5120
Resistance levels: 1.5755 1.5790 1.5840
USD/JPY Current price: 123.96
View Live Chart for the USD/JPY
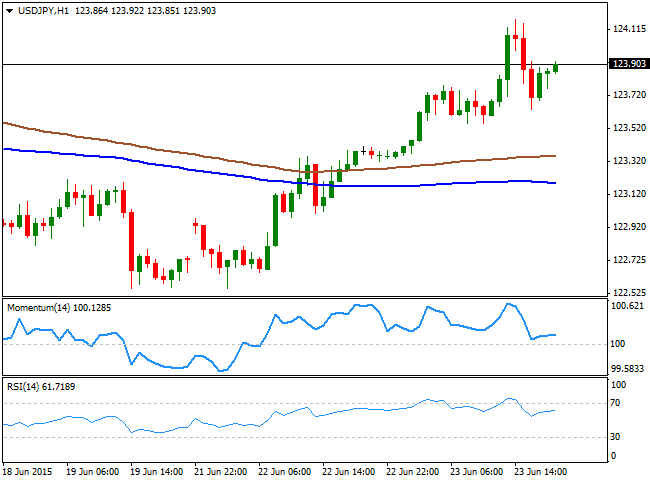
The USD/JPY pair surged up to 124.17, but was unable to sustain gains above the 124.00 level, holding however, nearby. During the past Asian session, Japan released its Flash Manufacturing PMI for June, down to 49.9 against 50.9 in May, signaling economic contraction in the economy. Although the reading is barely below the 50 mark, investors are probably starting to price in further stimulus coming from the BOJ, which means the pair may return to the 125.00 region. Technically however, the 1 hour chart shows that the technical indicators retraced from overbought territory, now heading slightly higher above their mid-lines, whilst the price extended above its 100 and 200 SMAs, both now in the 123.00/30 region. In the 4 hours chart, the price is aiming to advance beyond its 100 SMA, whilst the technical indicators present a more constructive stance, heading higher well above their mid-lines. Nevertheless, some follow through above the immediate resistance at 124.10, is required to confirm a new leg higher and an approach to the 125.00 level.
Support levels: 123.70 123.30 122.90
Resistance levels: 124.10 124.45 124.90
AUD/USD Current price: 0.7722
View Live Chart for the AUD/USD
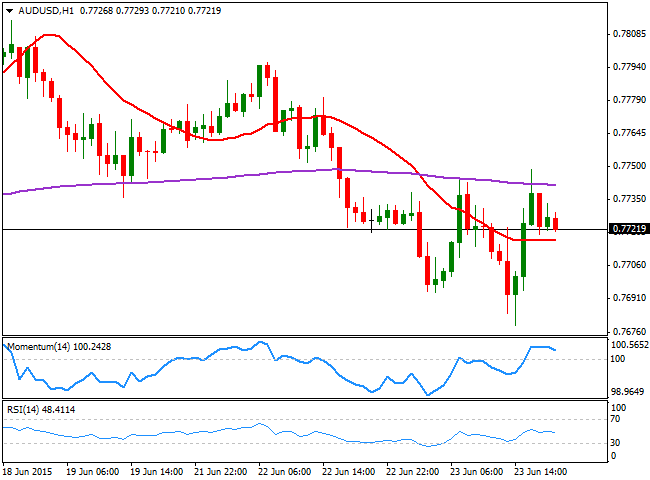
Aussie was hit during the past Asian session by worse-than-expected Chinese and Australian data. In Australia, the first quarter House Price Index rose less than expected, reaching 1.6% against expectations of 2% advance, increasing possibilities of another rate cut in Australia. In Chine, June Manufacturing PMI printed 49.6, slightly above expected, but still in contraction territory, for the fourth straight month. The AUD/USD pair fell down to 0.7679, but managed to bounce during the American afternoon, despite general dollar strength, ending the day flat in the 0.7720 region. The technical picture is neutral in the short term, as the price stands above a horizontal 20 SMA, whilst the technical indicators lack directional strength, but hold in positive territory. In the 4 hours chart, the latest advance stalled around a bearish 20 SMA, now offering an immediate intraday resistance around 0.7750, whilst the technical indicators hold flat below their mid-lines.
Support levels: 0.7680 0.7640 0.7600
Resistance levels: 0.7750 0.7785 0.7820
Recommended Content
Editors’ Picks
AUD/USD maintains ground near the major level, Australian Budget Release eyed

AUD/USD retraces its recent gains on Tuesday ahead of the Yearly Budget Release by the Australian Government due to be published later in the day. Treasurer Jim Chalmers hinted at positive developments suggesting that the upcoming budget could show a faster decline in inflation than the RBA had predicted.
EUR/USD tests the upper boundary around the level of 1.0800

EUR/USD has recovered its recent gains registered in the previous session, trading around 1.0780 during the Asian session on Tuesday. From a technical perspective, analysis indicates a sideways trend for the pair as it continues to lie within the symmetrical triangle.
Gold price gains ground ahead of US PPI data, Fed’s Powell speech

Gold price rebounds despite the consolidation of the US Dollar on Tuesday. The upside of yellow metal might be limited as traders might wait on the sidelines ahead of key US inflation data this week. The higher-for-longer US rate mantra has exerted some selling pressure on the XAU/USD in recent sessions.
Top meme coins post gains following increased social activity amid GameStop pump

Meme coins in the crypto market saw impressive gains on Monday following a recent surge in GameStop stock. The increased attention surrounding these tokens signifies a potential resumption of the meme coin frenzy of March.
PPI to test the soft landing narrative

Investors brace for key U.S. inflation data, which are anticipated to play a crucial role in shaping the outlook for Federal Reserve policy and contributing to the market's cautious stance. Investors are particularly sensitive to this data, given its potential to influence interest rate decisions and broader market sentiment.
