EUR/USD Current price: 1.1141
View Live Chart for the EUR/USD
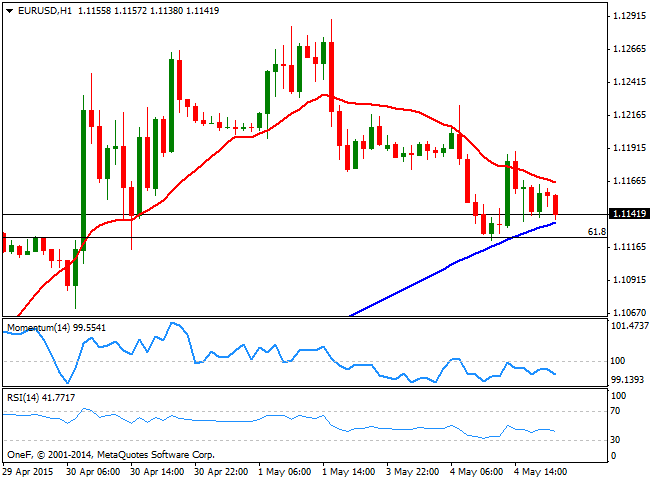
It was a quiet start of the week with Japan and London off on holidays, and inventors in wait and see mode ahead of big macroeconomic news later on in the week. The EUR/USD pair surged to a daily high of 1.1224 before closing in the red, near the low set early Europe around 1.1122. During the European session, data showed that manufacturing growth was uneven in the Euro area, as the April Markit Manufacturing PMIs for the region as a whole and Germany ticked higher, but fell further into contraction in France and Greece. Investor's confidence in the area dropped from previous 20 to 19.6 according to the Sentix survey, also weighing on the common currency. As for US data, it came out generally positive, supporting rather a recovery in local equities rather than in the greenback itself.
The short term technical picture favors the downside, as the 1 hour chart shows that the price develops below a mild bearish 20 SMA, whilst the technical indicators head lower below their mid-lines, albeit the 100 SMA has provided intraday support during the day, now a few pips below the current level. In the 4 hours chart, the price is standing below its 20 SMA that has lost its upward slope and turns now flat, whilst the technical indicators head lower below their mid-lines, supporting additional declines. Nevertheless, the pair needs to break below the 1.1120 Fibonacci support to be able to extend its decline, eyeing a test of the 1.1050 region afterwards.
Support levels: 1.1120 1.1085 1.1050
Resistance levels: 1.1160 1.1200 1.1245
EUR/JPY Current price: 133.87
View Live Chart for the EUR/JPY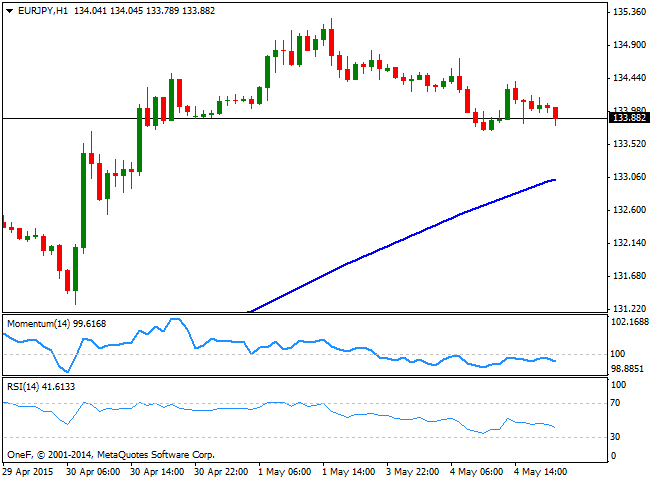
The EUR self weakens pushed the EUR/JPY cross slightly lower this Monday, with the pair losing some 50 pips intraday, with yen strength limited amid market's positive mood. The technical picture in the short term is mild bearish, as the technical indicators have turned lower after failing below their mid-lines, whilst the 100 SMA maintains a strong bullish slope, providing intraday support should the fair extend its fall, in the 133.00 region. In the 4 hours chart the Momentum indicator turned sharply lower and is about to cross its mid-line towards the downside, whilst the RSI indicator also heads lower around 59, also pointing for additional slides, particularly if the pair is unable to recover above the 134.00 region.
Support levels: 133.55 133.00 132.60
Resistance levels: 134.10 134.70 135.20
GBP/USD Current price: 1.5117
View Live Chart for the GBP/USD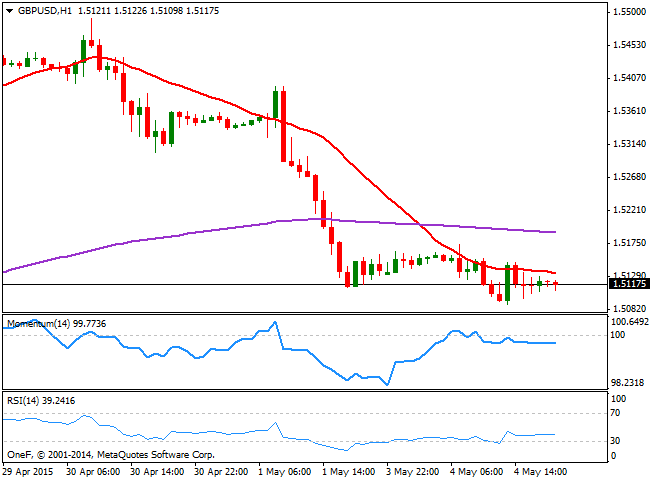
The GBP/USD pair fell down to 1.5089 before finding some short term demand, but for the most traded in quite a limited range amid London holiday and the upcoming UK general elections. The latest polls show that Conservatives may be taking the lead, but they are far from securing a majority in Parliament, which keeps making of Pound a non attractive investment at the time being. With no fundamental data released, and none schedule for Tuesday, the British Pound will likely remain under pressure. Technically, the 1 hour chart shows that the price is developing below a flat 20 SMA, whilst the technical indicators stand below their mid-lines, albeit lacking strength at the time being. In the 4 hours chart the 20 SMA extended its decline well above the current levels, now in the 1.5270 region, whilst the Momentum indicator turned slightly higher from overbought levels, but the RSI maintains a bearish tone around 31. In this last time frame, the 200 EMA stands around 1.5040, providing strong dynamic support. If the price breaks below it however, the pair will likely accelerate its decline towards fresh lows near the 1.5000 figure.
Support levels: 1.5085 1.5040 1.5000
Resistance levels: 1.5130 1.5170 1.5210
USD/JPY Current price: 120.06
View Live Chart for the USD/JPY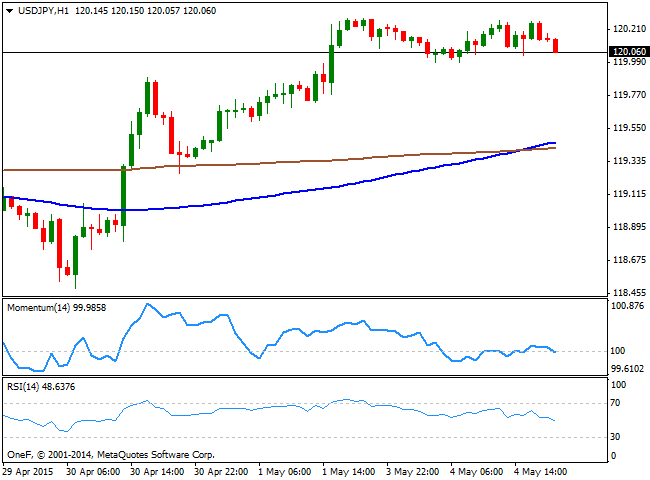
The USD/JPY has traded between a daily low of 119.99 and a high of 120.26, consolidating its last week gains. The yen aimed to advance late in the US session, erasing an early upward momentum in the pair. Technically, the 1 hour chart shows that the Momentum indicator turned south around 100 whilst the RSI indicator heads lower around 48, limiting chances of an upcoming advance. In the same chart, the 100 SMA crossed above the 200 SMA in the 119.30/40 region, providing intraday support if the decline extends this Tuesday. In the 4 hours chart, the technical indicators have turned sharply lower from overbought territory, whilst the 100 and 200 SMA are standing now flat in the 119.20/50 region, with the shortest below the largest, reflecting limited buying interest around the pair. A downward acceleration below the 120.00 figure should open doors for a continued slide, eyeing then the 119.30 as a probable intraday bearish target.
Support levels: 120.00 119.65 119.30
Resistance levels: 120.45 120.85 122.10
AUD/USD Current price: 0.7841
View Live Chart for the AUD/USD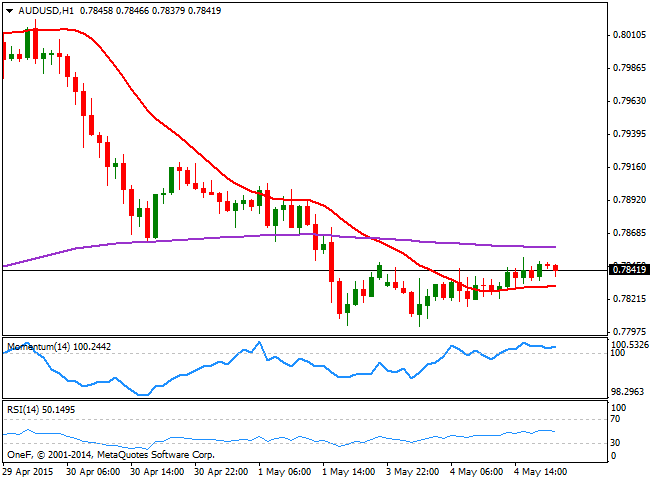
The AUD/USD pair has been confined to a tight range, having been as low as 0.7801 early in the Asian opening. The RBA will have its economic policy meeting this Tuesday, and market expectations are of a 0.25% rate cut from current 2.25%, as the local economy continues to falter. The RBA has been expected to cut rates ever since its last cut in February, and the decision to stay on hold have triggered strong intraday spikes in the Aussie. There are some market talks on the possibility of a 0.50% cut, something that should trigger a sell-off in the commodity currency. Technically, the 1 hour chart shows a mild positive tone, as the price stands above its 20 SMA, whilst the technical indicators hold flat above their mid-lines. In the 4 hours chart the 20 SMA heads strongly lower above the current price, in the 0.7890 region, whilst the Momentum indicator heads higher below 100 and the RSI indicator also aims north around 44. A positive surprise can take the pair up to 0.7940, a strong static resistance area where sellers are expected to surge.
Support levels: 0.7800 0.7770 70.7730
Resistance levels: 0.7860 0.7890 0.7940
Recommended Content
Editors’ Picks
EUR/USD edges lower toward 1.0700 post-US PCE

EUR/USD stays under modest bearish pressure but manages to hold above 1.0700 in the American session on Friday. The US Dollar (USD) gathers strength against its rivals after the stronger-than-forecast PCE inflation data, not allowing the pair to gain traction.
GBP/USD retreats to 1.2500 on renewed USD strength

GBP/USD lost its traction and turned negative on the day near 1.2500. Following the stronger-than-expected PCE inflation readings from the US, the USD stays resilient and makes it difficult for the pair to gather recovery momentum.
Gold struggles to hold above $2,350 following US inflation

Gold turned south and declined toward $2,340, erasing a large portion of its daily gains, as the USD benefited from PCE inflation data. The benchmark 10-year US yield, however, stays in negative territory and helps XAU/USD limit its losses.
Bitcoin Weekly Forecast: BTC’s next breakout could propel it to $80,000 Premium

Bitcoin’s recent price consolidation could be nearing its end as technical indicators and on-chain metrics suggest a potential upward breakout. However, this move would not be straightforward and could punish impatient investors.
Week ahead – Hawkish risk as Fed and NFP on tap, Eurozone data eyed too

Fed meets on Wednesday as US inflation stays elevated. Will Friday’s jobs report bring relief or more angst for the markets? Eurozone flash GDP and CPI numbers in focus for the Euro.