EUR/USD Current price: 1.1307
View Live Chart for the EUR/USD
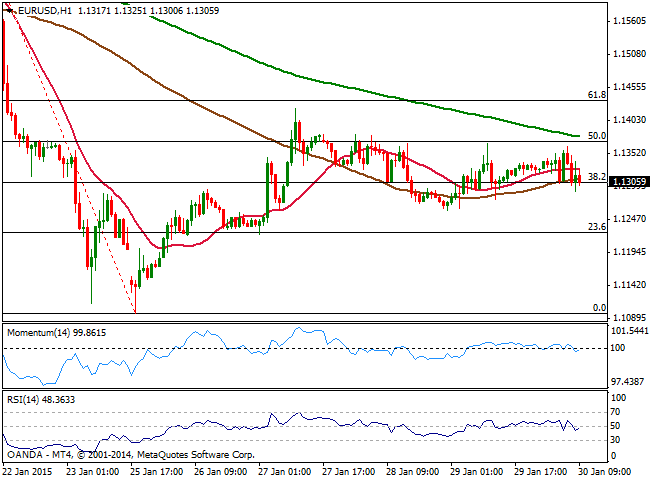
The EUR/USD pair can’t find a way this Friday, trading around its daily opening and despite key macroeconomic data has been released for both economies. Earlier on the day, EZ inflation turned out negative, a confirmation of the ongoing deflation in the area. In the US, GDP figures showed the economy expanded at a slower pace than forecasted in the QE, printing 2.6% against an expected 3.3% grow. The EUR/USD however, continues to trade in the lows 1.13’ with the 1 hour chart showing price moving back and forth around 20 and 100 SMAs, both flat in a 10 pip range, while indicators hold in neutral territory. In the 4 hours chart indicators turn slightly lower but also around their midlines, lacking directional strength at the time being. Selling interest has surged again earlier on the day near the 50% retracement of the latest bearish run at 1.1365, becoming the critical resistance to break to confirm an upward extension. The main support on the other hand, stands at 1.1250 a static support as per several intraday lows posted around it during these last few days.
Support levels: 1.1250 1.1210 1.1160
Resistance levels: 1.1365 1.1400 1.1440
GBP/USD Current price: 1.5046
View Live Chart for the GBP/USD
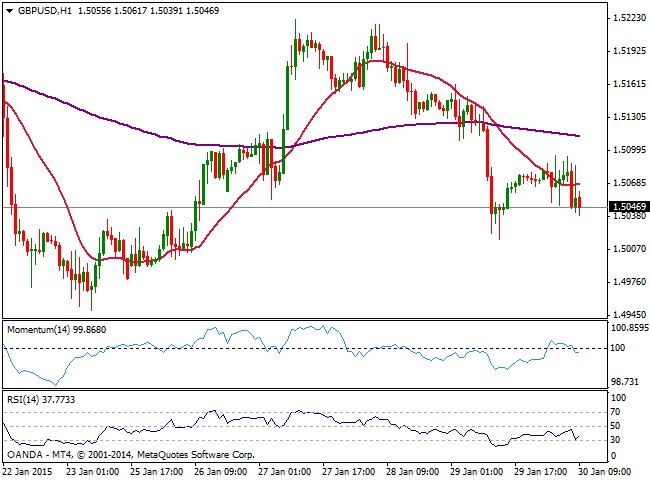
The GBP/USD pair maintains a heavy tone, trading near its daily low of 1.5039. Data coming from the UK showed that mortgage approvals rose in December for the first time since June, halting the steady slowdown of these last months. The 1 hour chart shows that the price develops below its 20 SMA while indicators present a mild negative tone below their midlines, albeit with no actual momentum. In the 4 hours chart technical indicators present a clear bearish tone, extending their decline below their midlines and pointing for some further declines particularly on a break below 1.5010 immediate support.
Support levels: 1.5010 1.4970 1.4925
Resistance levels: 1.5060 1.5100 1.5150
USD/JPY Current price: 117.41
View Live Chart for the USD/JPY
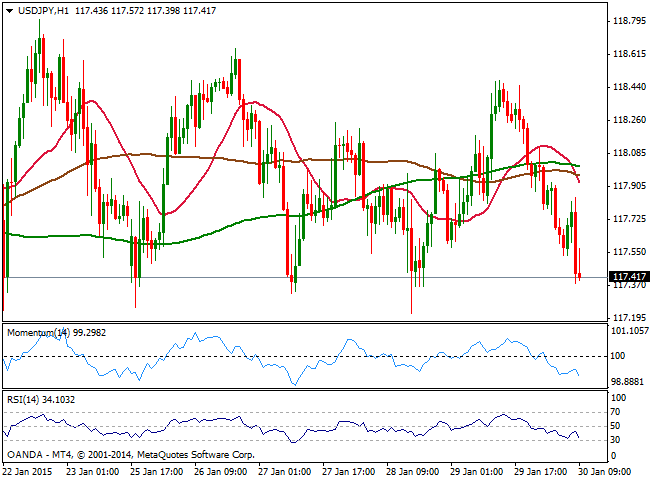
The USD/JPY pressures the bottom of its range, accelerating below its moving averages in the hourly chart, and with indicators gaining bearish strength below their midlines, keeping the risk to the downside. Stocks pointing for a negative opening are weighting on the pair that anyway needs to break below the 117.00 figure to confirm a bearish continuation. In the 4 hours chart, the overall tone is mild bearish, with the price below moving averages and indicators gaining bearish slope around their midlines.
Support levels: 117.30 117.00 116.60
Resistance levels: 117.80 118.30 118.80
AUD/USD Current price: 0.7749
View Live Chart of the AUD/USD
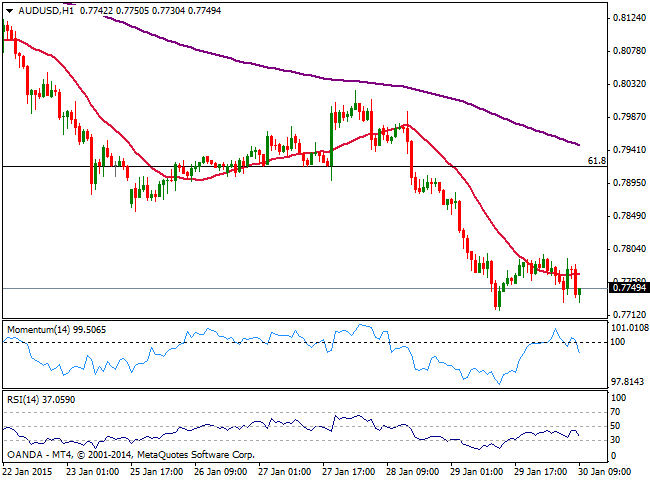
The AUD/USD pair trades steady near its multi-year low of 0.7720, having found sellers on approaches to the 0.7800 figure earlier on the day. The 1 hour chart shows indicators heading lower below their midlines, while 20 SMA stands flat above current price. In the 4 hours chart indicators stand directionless in oversold territory, while 20 SMA maintains a strong bearish slope well above current price, offering dynamic resistance around 0.7860 in case of an unlikely recovery.
Support levels: 0.7700 0.7665 0.7630
Resistance levels: 0.7820 0.7860 0.7900
Recommended Content
Editors’ Picks
EUR/USD edges lower toward 1.0700 post-US PCE

EUR/USD stays under modest bearish pressure but manages to hold above 1.0700 in the American session on Friday. The US Dollar (USD) gathers strength against its rivals after the stronger-than-forecast PCE inflation data, not allowing the pair to gain traction.
GBP/USD retreats to 1.2500 on renewed USD strength

GBP/USD lost its traction and turned negative on the day near 1.2500. Following the stronger-than-expected PCE inflation readings from the US, the USD stays resilient and makes it difficult for the pair to gather recovery momentum.
Gold struggles to hold above $2,350 following US inflation

Gold turned south and declined toward $2,340, erasing a large portion of its daily gains, as the USD benefited from PCE inflation data. The benchmark 10-year US yield, however, stays in negative territory and helps XAU/USD limit its losses.
Bitcoin Weekly Forecast: BTC’s next breakout could propel it to $80,000 Premium

Bitcoin’s recent price consolidation could be nearing its end as technical indicators and on-chain metrics suggest a potential upward breakout. However, this move would not be straightforward and could punish impatient investors.
Week ahead – Hawkish risk as Fed and NFP on tap, Eurozone data eyed too

Fed meets on Wednesday as US inflation stays elevated. Will Friday’s jobs report bring relief or more angst for the markets? Eurozone flash GDP and CPI numbers in focus for the Euro.