EUR/USD Current price: 1.2278
View Live Chart for the EUR/USD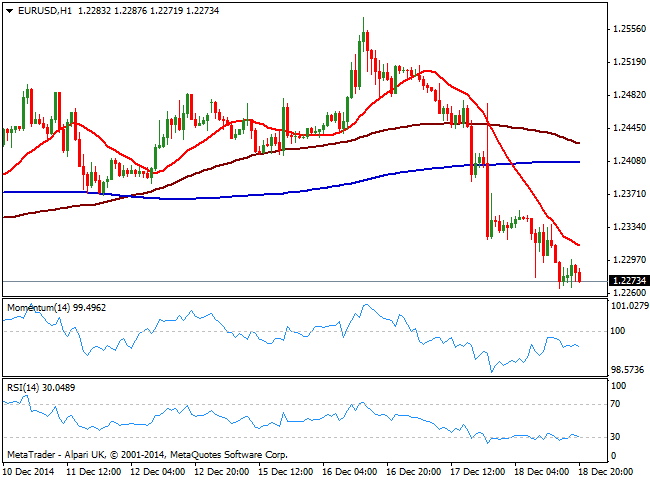
The EUR/USD pair extended its decline on Thursday down to 1.2266, having remained capped below the 1.2300 figure for most of the US session. The latest FED’s decision has restored investors’ confidence with stocks closing strongly up across the world. Earlier on the day, German IFO survey showed confidence rose for a second month as the economy shows signs of strengthening, but it was not enough to trigger EUR demand. In the US data came out mixed, with unemployment claims decreasing to 289K in the week ending Dec 12, but Markit Services PMI edged lower down to 53.6. But the main fundamental weight came from the SNB, as the Switzerland Central Bank surprise markets cutting rates to negative, in order to discourage safe-haven buying of francs, down to -0.25% and protect EUR/CHF peg.
The short term technical picture for the EUR/USD continues to favor the downside, as the 1 hour chart shows that the price remained contained in its advances by a strongly bearish 20 SMA, whilst indicators head south well into negative territory. In the 4 hours chart indicators also head clearly lower despite in oversold territory, whilst 20 SMA turned south well above current price. The year low stands at 1.2240, and is acting now as the immediate support level, with a break below it probably triggering large stops and fueling the selloff towards the 1.2150 price zone.
Support levels: 1.2240 1.2190 1.2150
Resistance levels: 1.2315 1.2360 1.2400
EUR/JPY Current price: 145.92
View Live Chart for the EUR/JPY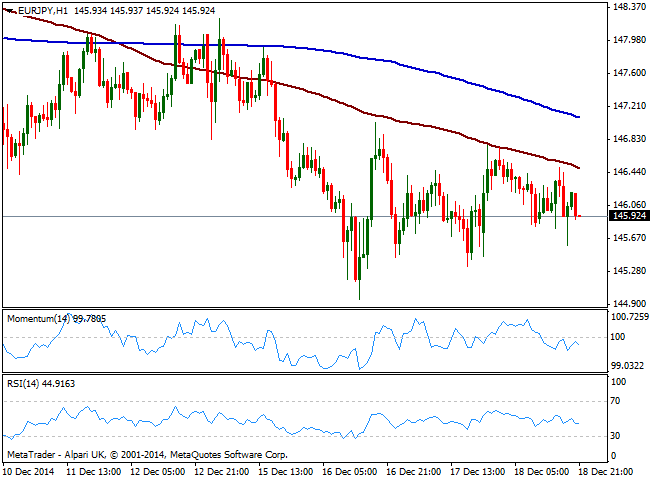
The EUR/JPY cross edged lower in the day, lead by EUR weakness. Despite the Japanese yen has been also on the losing side this Thursday, the pair trades below the 146.00 level and with the 1 hour chart showing 100 SMA acting as dynamic resistance since early Asian session, currently at 146.50, while indicators head lower below their midlines. In the 4 hours chart indicators diverge from each other around their midlines, giving little clues on upcoming direction. The overall stance however is still bearish, with a break below 145.55 exposing the weekly low of 144.95.
Support levels: 145.55 144.95 144.60
Resistance levels: 146.15 146.50 146.90
GBP/USD Current price: 1.5662
View Live Chart for the GBP/USD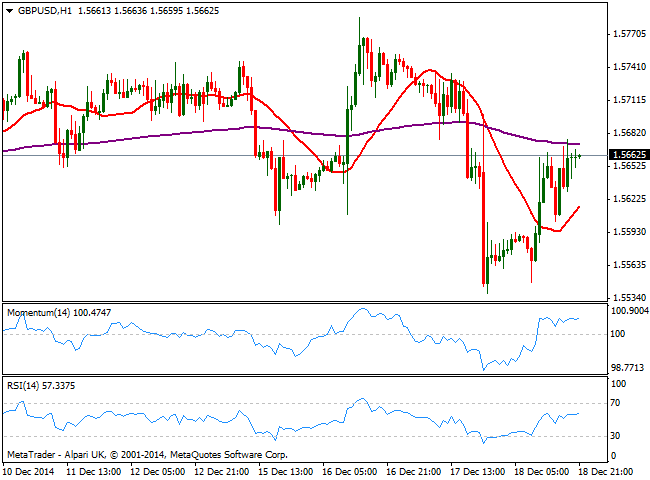
The British Pound held to its early gains against the greenback, triggered by UK Retail Sales that surged above expectations in November, as Black Friday boosted sales. The monthly reading rose 1.6%, the biggest increase this year, and the YoY reading gained 6.4%, the largest in over a decade. The GBP/USD pair posted a higher low daily basis of 1.5548 before surging to 1.5676 mid American afternoon, consolidating a few pips below it afterwards. Technically, the 1 hour chart shows 20 SMA turned back higher below the current price, while indicators lost directional strength but remain in positive territory. In the 4 hours chart however, indicators are biased lower in negative territory, while the price is being unable to overcome its 20 SMA around the mentioned daily high. The 1.5610/20 area is the immediate static support for the upcoming hours, and it will take a clear break below to confirm a bearish continuation in the pair, while sellers may surge on advances up to 1.5730/70 price zone.
Support levels: 1.5615 1.5590 1.5540
Resistance levels: 1.5685 1.5735 1.5770
USD/JPY Current price: 118.84
View Live Chart for the USD/JPY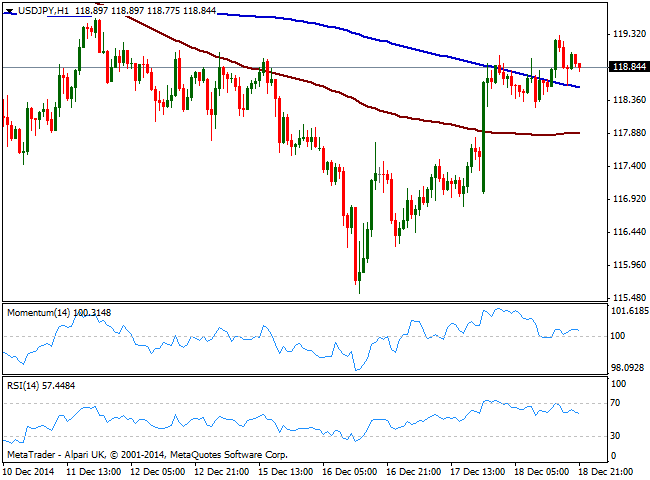
The USD/JPY pair has showed a quite shallow advance despite markets’ renewed optimism, surging to a fresh 4.day high of 119.30, but retracing back below the 119.00 figure to close the day barely 20 pips above its opening. Lately, the yen has been quite attached to Russia and Oil developments, strengthening on risk aversion and seems investors are still wary when it comes to sell the yen. Technically, the 1 hour chart shows price advanced above its 200 SMA that anyway maintains a bearish slope, now acting as dynamic support around 118.50. Indicators in the same time frame turned lower but remain above their midlines, which limits chances of a slide in the short term. In the 4 hours chart momentum continues to head higher above 100 while RSI stands around 56, supporting the shorter term view. At this point, the pair needs to advance above 119.45 to be able to extend its gains towards the 120.00 figure, with increasing downward potential mentioned 118.50 support gives up.
Support levels: 118.50 118.20 117.70
Resistance levels: 119.00 119.45 119.90
AUD/USD Current price: 0.8152
View Live Chart of the AUD/USD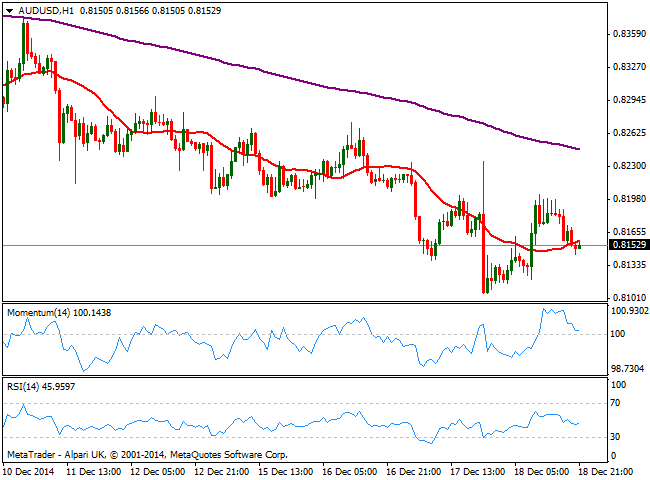
The Australian dollar surged against the greenback after reaching 0.8106 following the FED, with the AUD/USD pair reaching a daily high of 0.8202, before retracing some. The early recovery was due to easing concerns over the Russian crisis and a mild recovery in commodity prices. Trading mid range, the AUD/USD 1 hour chart shows that the price is hovering around its 20 SMA, while indicators remain above their midlines. In the 4 hours chart the bearish bias prevails with the price still unable to overcome its 20 SMA, currently around 0.8190, and indicators heading south into negative territory. Despite the pair may continue to correct higher especially if the price advances above 0.8200, the dominant trend is still bearish and sellers may surge near 0.8270 if reached. Nevertheless the downside continues to be favored with large stops suspected below 0.8105: if triggered, the pair can extend down to 0.7940 key long term support.
Support levels: 0.8145 0.8105 0.8060
Resistance levels: 0.8190 0.8230 0.8270
Recommended Content
Editors’ Picks
EUR/USD edges lower toward 1.0700 post-US PCE

EUR/USD stays under modest bearish pressure but manages to hold above 1.0700 in the American session on Friday. The US Dollar (USD) gathers strength against its rivals after the stronger-than-forecast PCE inflation data, not allowing the pair to gain traction.
GBP/USD retreats to 1.2500 on renewed USD strength

GBP/USD lost its traction and turned negative on the day near 1.2500. Following the stronger-than-expected PCE inflation readings from the US, the USD stays resilient and makes it difficult for the pair to gather recovery momentum.
Gold struggles to hold above $2,350 following US inflation

Gold turned south and declined toward $2,340, erasing a large portion of its daily gains, as the USD benefited from PCE inflation data. The benchmark 10-year US yield, however, stays in negative territory and helps XAU/USD limit its losses.
Bitcoin Weekly Forecast: BTC’s next breakout could propel it to $80,000 Premium

Bitcoin’s recent price consolidation could be nearing its end as technical indicators and on-chain metrics suggest a potential upward breakout. However, this move would not be straightforward and could punish impatient investors.
Week ahead – Hawkish risk as Fed and NFP on tap, Eurozone data eyed too

Fed meets on Wednesday as US inflation stays elevated. Will Friday’s jobs report bring relief or more angst for the markets? Eurozone flash GDP and CPI numbers in focus for the Euro.