EUR/USD Current price: 1.3194
View Live Chart for the EUR/USD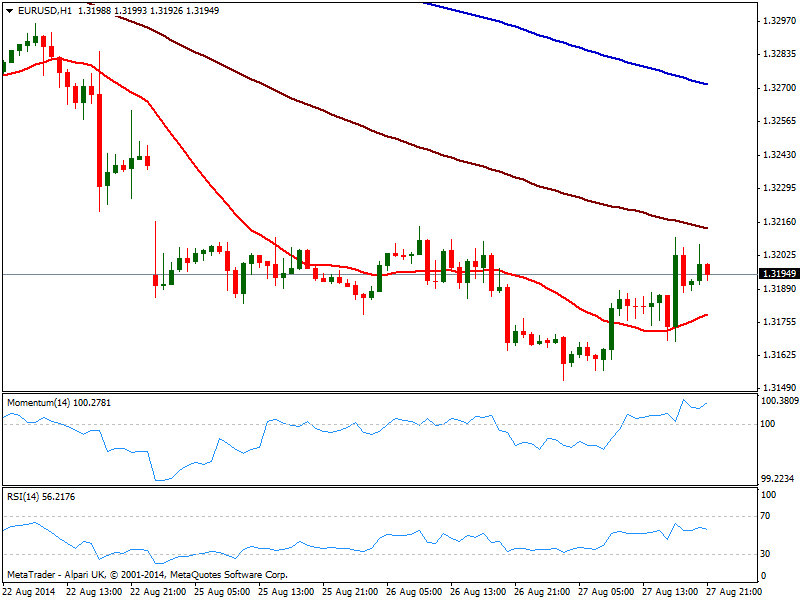
Dollar edged lower against most rivals in a profit taking driven day: there were no news to lead market over US session, and minor one in Europe, nothing enough to affect the FX board. Commodity currencies again took the lead, rising stronger than European ones that remained capped by critical resistance levels: the EUR/USD flirted with 1.3210 for a brief movement, unable however to advance beyond the weekly high of 1.3215 the key level to break to see a more upward constructive move. Some news suggesting is unlikely to see the ECB acting next week without an inflation slump, prompted investors out the EUR again. Nevertheless and despite positive, the daily candle shows a lower low and a lower high, which keeps the bearish trend alive.
Technically, the short term picture shows a mild positive tone, with price above a bullish 20 SMA in the hourly chart and indicators in positive territory, albeit showing no directional strength. In the 4 hours chart and despite some spikes above it, price remains capped by its 20 SMA currently around 1.3195, as indicators corrected oversold readings but lost upward potential below their midlines. Above 1.3215, the pair may finally fill the weekly opening gap in the 1.3240 area, yet further gains remain subdue to inflation data to be released on Friday.
Support levels: 1.3150 1.3120 1.3090
Resistance levels: 1.3215 1.3240 1.3280
EUR/JPY Current price: 137.07
View Live Chart for the EUR/JPY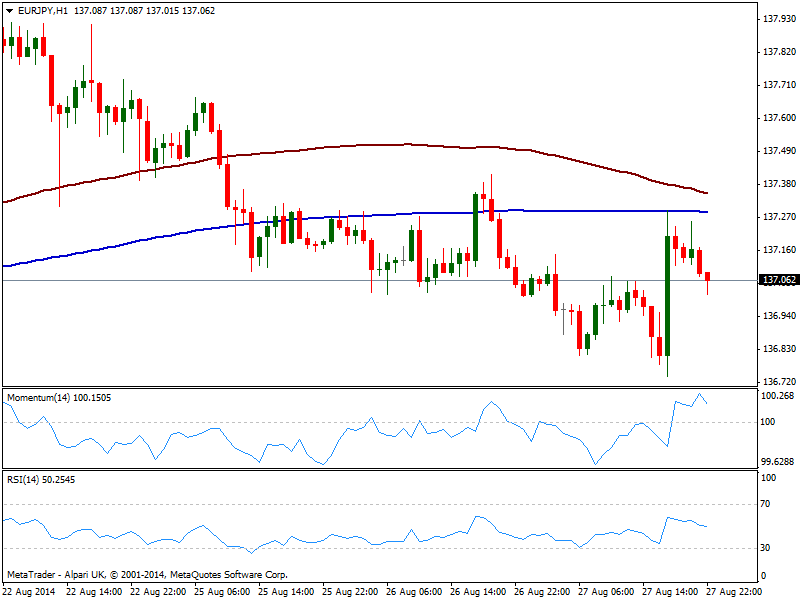
The EUR/JPY eased down to 136.74 before finding buyers, bouncing strongly up afterwards up to 137.30 price zone. The pair however, fade some of its latest gains and trades steady above the 137.00 level, with the hourly chart showing price being capped by its 200 SMA at mentioned 137.30 level, and indicators turning south above their midlines. In the 4 hours chart price hovers around its moving averages both in a 20 pips range and with a mild bearish tone; indicators in this last time frame stand in negative territory, with momentum heading higher but RSI lower, leaving a mixed picture at the time being. Still the pair has more chances to the downside, having been unable again to overcome the 137.30/40 price zone.
Support levels: 136.90 136.40 136.00
Resistance levels: 137.35 137.60 138.00
GBP/USD Current price: 1.6577
View Live Chart for the GBP/USD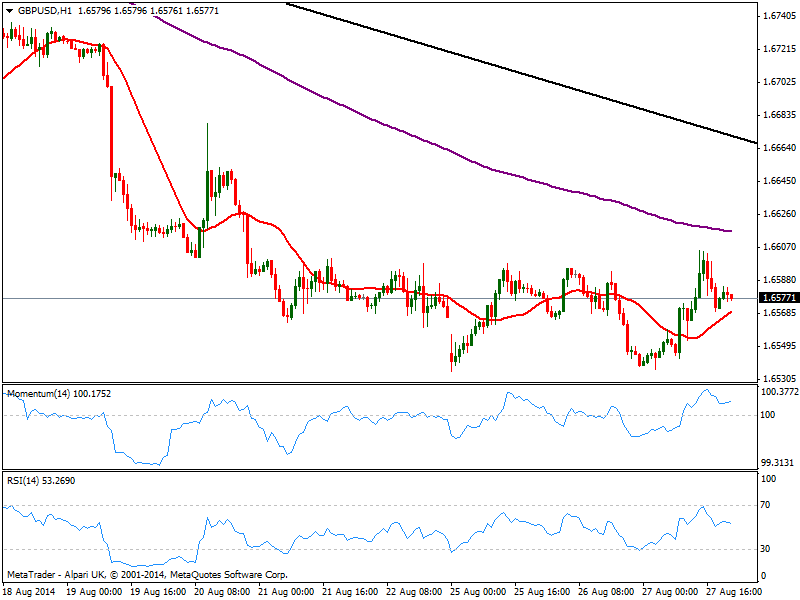
Pound faltered yet again at 1.6600 against the greenback, maintaining however a mild positive tone in the short term, as per the hourly chart shows 20 SMA aiming higher below current price and indicators directionless in positive territory. The level has attracted sellers several times over this week, so stops above it should be accumulating daily basis: a price acceleration through the level may finally trigger them and see a continuation rally up to 1.6650/60 price zone, where a daily descendant trend line coming from this year high your contain the pair ahead of next week data. As for bigger time frames, the technical picture remains quite neutral, as per the pair ranging in less than 100 pips for already a week. Having posted a daily low of 1.6538, a price acceleration through the level should deny the possibility of an upward correction an favor a leg lower which will probably target 1.6250 in the midterm.
Support levels: 1.6540 1.6490 1.6465
Resistance levels: 1.6600 1.6630 1.6660
USD/JPY Current price: 103.89
View Live Chart for the USD/JPY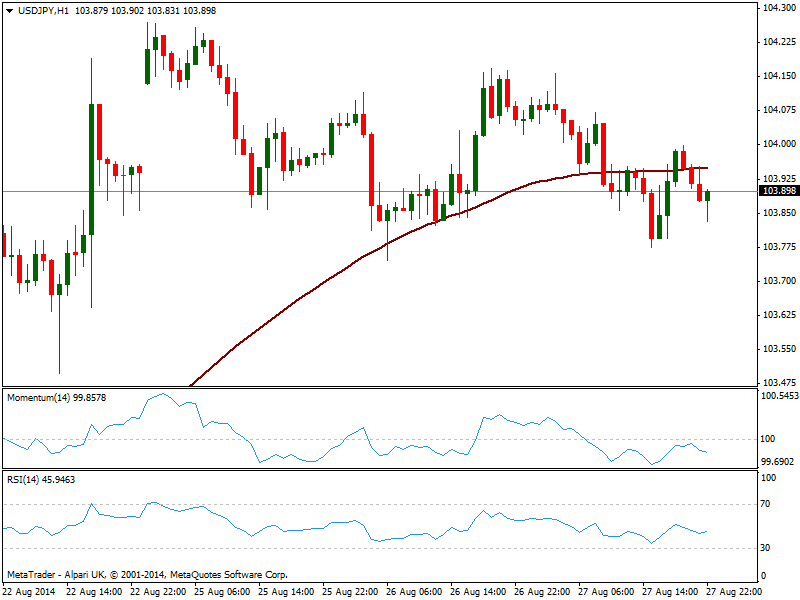
The USD/JPY has shown little progress over the last 24 hours, trading in the 103.70/104.20 range. Nevertheless, the bearish potential has increased amid the hourly chart showing price now below its 100 SMA, as 200 one approaches from below. Indicators in the same time frame lack clear strength but stand in negative territory, while the 4 hours chart shows indicators heading south, retreating from their midlines, which increases the risk of a break lower: some follow through below 103.70 however is required to confirm a leg lower eyeing then 103.20 price zone.
Support levels: 103.70 103.20 102.85
Resistance levels: 104.20 104.50 104.80
AUD/USD Current price: 0.9335
View Live Chart for the AUD/USD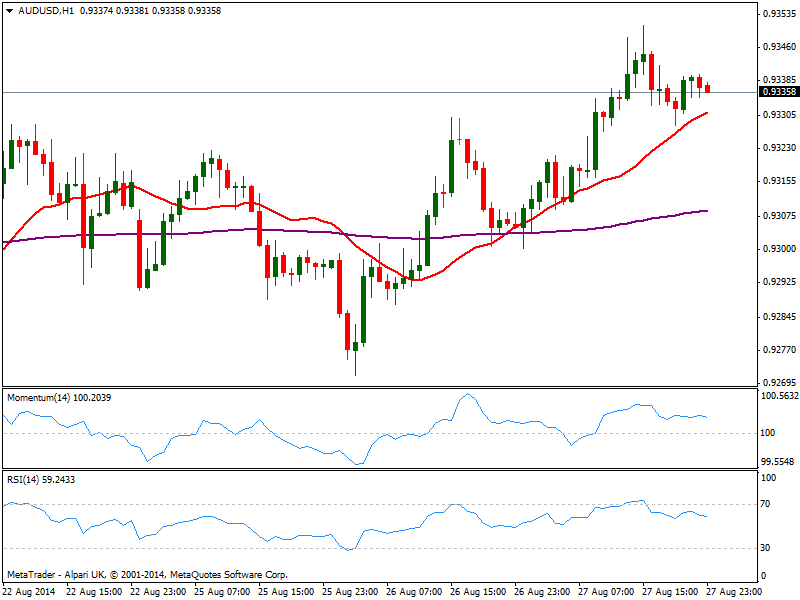
Australian dollar run above 0.9330 against the greenback early US opening, and holds above it as a new day starts, albeit not far away from it, having failed to extend its gains on quiet US afternoon. The technical picture is still bullish in the short term, but lacks momentum, as price holds above a bullish 20 SMA but indicators are flat. In the 4 hours chart the picture is exactly the same, bullish but lacking strength. As long as above 0.9330 downward risk will remain limited yet if the pair breaks below the level again, bears will likely took their chances and push price back below the 0.9300 mark.
Support levels: 0.9330 0.9300 0.9260
Resistance levels: 0.9370 0.9410 0.9450
Recommended Content
Editors’ Picks
EUR/USD edges lower toward 1.0700 post-US PCE

EUR/USD stays under modest bearish pressure but manages to hold above 1.0700 in the American session on Friday. The US Dollar (USD) gathers strength against its rivals after the stronger-than-forecast PCE inflation data, not allowing the pair to gain traction.
GBP/USD retreats to 1.2500 on renewed USD strength

GBP/USD lost its traction and turned negative on the day near 1.2500. Following the stronger-than-expected PCE inflation readings from the US, the USD stays resilient and makes it difficult for the pair to gather recovery momentum.
Gold struggles to hold above $2,350 following US inflation

Gold turned south and declined toward $2,340, erasing a large portion of its daily gains, as the USD benefited from PCE inflation data. The benchmark 10-year US yield, however, stays in negative territory and helps XAU/USD limit its losses.
Bitcoin Weekly Forecast: BTC’s next breakout could propel it to $80,000 Premium

Bitcoin’s recent price consolidation could be nearing its end as technical indicators and on-chain metrics suggest a potential upward breakout. However, this move would not be straightforward and could punish impatient investors.
Week ahead – Hawkish risk as Fed and NFP on tap, Eurozone data eyed too

Fed meets on Wednesday as US inflation stays elevated. Will Friday’s jobs report bring relief or more angst for the markets? Eurozone flash GDP and CPI numbers in focus for the Euro.